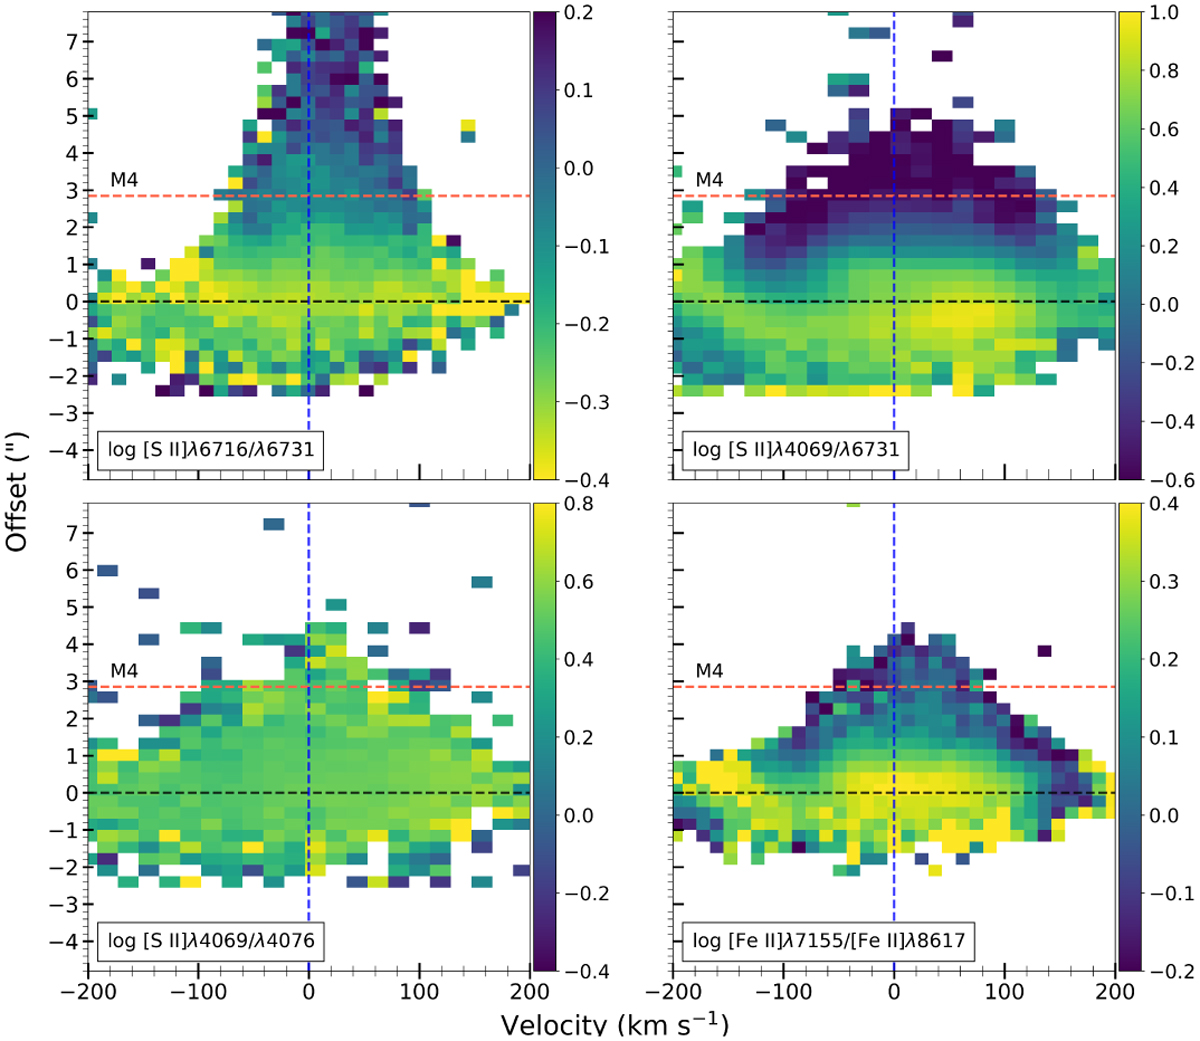
Fig. 6
Download original image
PV maps from the X-shooter data of the Th 28 jet, showing line ratios tracing ne. The red-shifted jet lobe is located above the source position, with the blue-shifted lobe below. The maps for each line ratio are dereddened and binned along both axes by a factor of 2. Colour maps are as in Fig. 5 and the knot M4 is marked with a dashed red line.
Current usage metrics show cumulative count of Article Views (full-text article views including HTML views, PDF and ePub downloads, according to the available data) and Abstracts Views on Vision4Press platform.
Data correspond to usage on the plateform after 2015. The current usage metrics is available 48-96 hours after online publication and is updated daily on week days.
Initial download of the metrics may take a while.