Fig. 5
Download original image
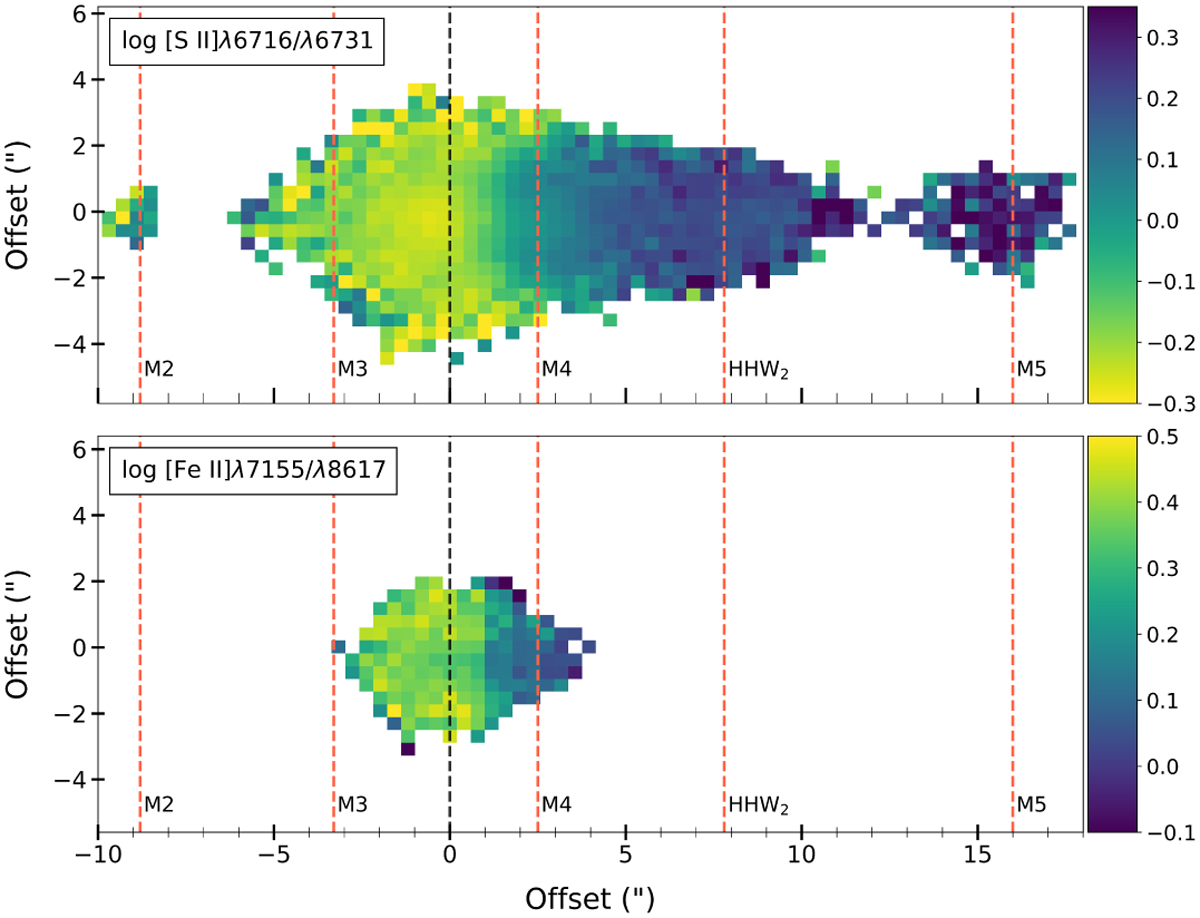
Line ratio maps of the Th 28 jet from the MUSE channel maps (−200 to +140 km s−1), showing line ratios which trace ne. Pixels with flux below 3 σ of the background in any of the constituent emission lines have been excluded. Source and knot positions are marked by black and red vertical dashed lines, respectively, with knot positions as defined in Murphy et al. (2021). Colour scaling is orientated to show the regions of highest ne in yellow.
Current usage metrics show cumulative count of Article Views (full-text article views including HTML views, PDF and ePub downloads, according to the available data) and Abstracts Views on Vision4Press platform.
Data correspond to usage on the plateform after 2015. The current usage metrics is available 48-96 hours after online publication and is updated daily on week days.
Initial download of the metrics may take a while.