Fig. 4
Download original image
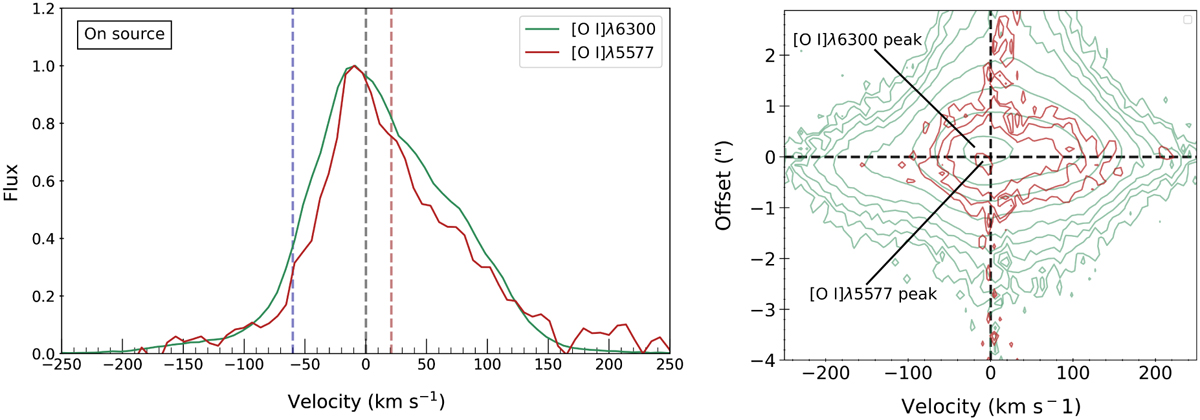
Comparison of the [O I]λ6300 and [O I]λ5577 emission in the X-shooter data. In both panels [O I]λ6300 is shown in green, [O I]λ5577 in red. Left: flux-normalised line profiles sampled at the source position. The estimated radial velocities of the blue- and red-shifted lobes are shown with vertical blue and red dashed lines at −100 km s−1 and +20 km s−1, respectively, while the 0 km s−1 velocity position is shown with the vertical black line. Right: PV maps from the X-shooter spectra showing the blue-shifted jet lobe, with contours starting at 3σ of the background level. On both axes the 0 position is marked with a black dashed line.
Current usage metrics show cumulative count of Article Views (full-text article views including HTML views, PDF and ePub downloads, according to the available data) and Abstracts Views on Vision4Press platform.
Data correspond to usage on the plateform after 2015. The current usage metrics is available 48-96 hours after online publication and is updated daily on week days.
Initial download of the metrics may take a while.