Fig. 3
Download original image
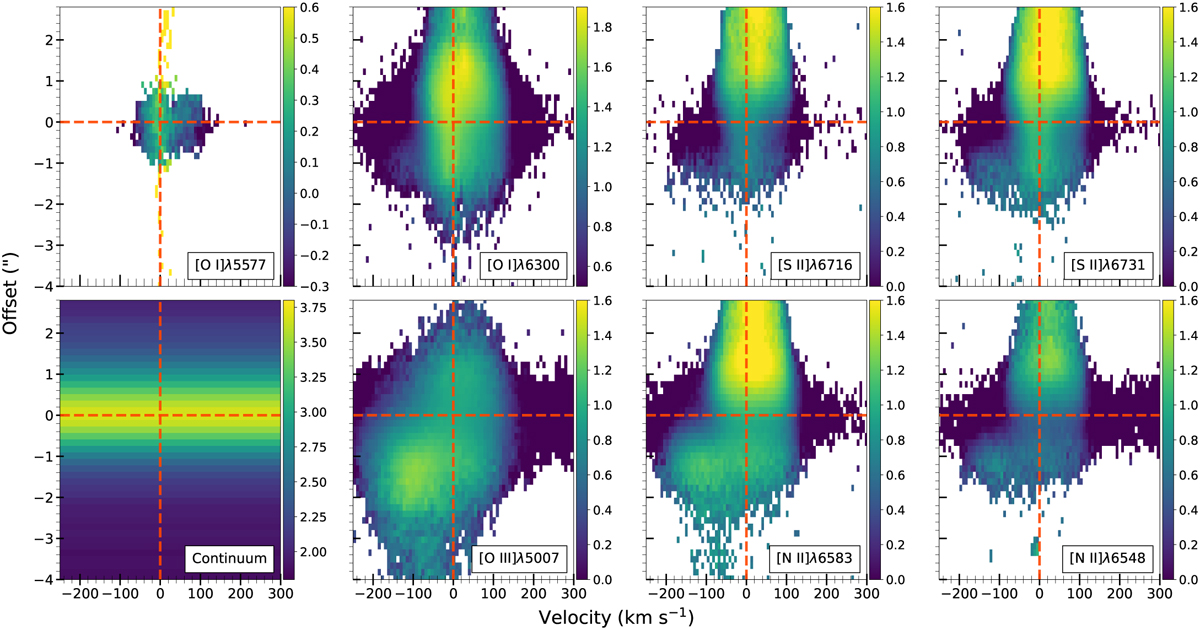
PV maps of the line-to-continuum emission ratio in eight FELs, obtained from the X-shooter data. All images are shown in log scale and aligned with the blue-shifted lobe toward the bottom of the panel (negative-y direction). Top: [O I] and [S II] lines; [O I]λ5577 primarily traces the LVC while [O I]λ6300 and [S II] trace both the high-velocity jet and LVC. Bottom: far-left panel shows an image of the continuum emission flux. The remaining panels show [O III] and [N II] lines that trace the high-velocity jet only.
Current usage metrics show cumulative count of Article Views (full-text article views including HTML views, PDF and ePub downloads, according to the available data) and Abstracts Views on Vision4Press platform.
Data correspond to usage on the plateform after 2015. The current usage metrics is available 48-96 hours after online publication and is updated daily on week days.
Initial download of the metrics may take a while.