Fig. 2
Download original image
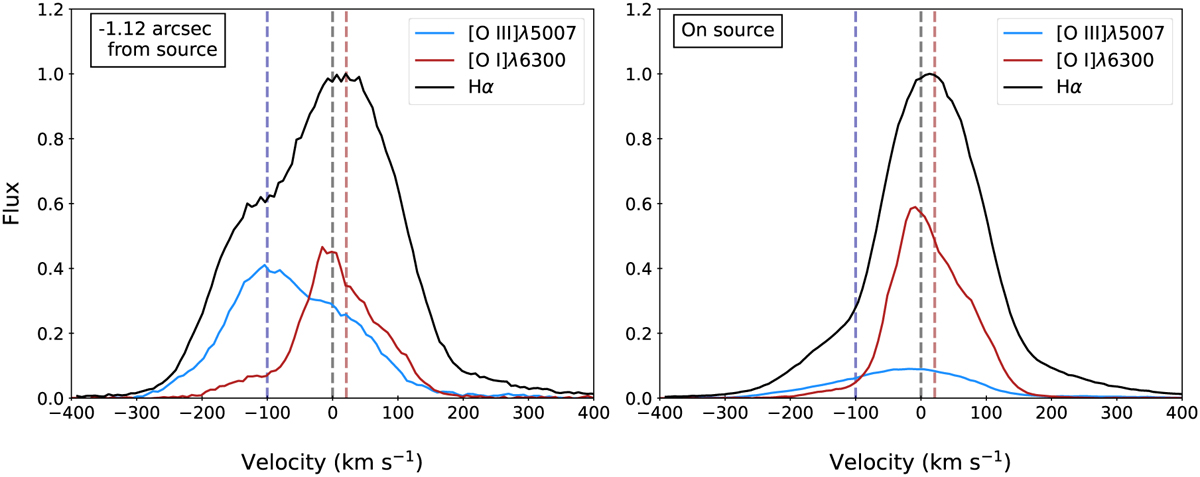
Emission line profiles at two spatial positions in the X-shooter data. Left: blue-shifted jet; right, the source position. All velocities are given with respect to the LSR. The estimated radial velocities of the blue- and red-shifted lobes are shown with vertical blue and red dashed lines at −100 km s−1 and +20 km s−1, respectively, while the 0 km s−1 velocity position is shown with the vertical black line.
Current usage metrics show cumulative count of Article Views (full-text article views including HTML views, PDF and ePub downloads, according to the available data) and Abstracts Views on Vision4Press platform.
Data correspond to usage on the plateform after 2015. The current usage metrics is available 48-96 hours after online publication and is updated daily on week days.
Initial download of the metrics may take a while.