Fig. 15
Download original image
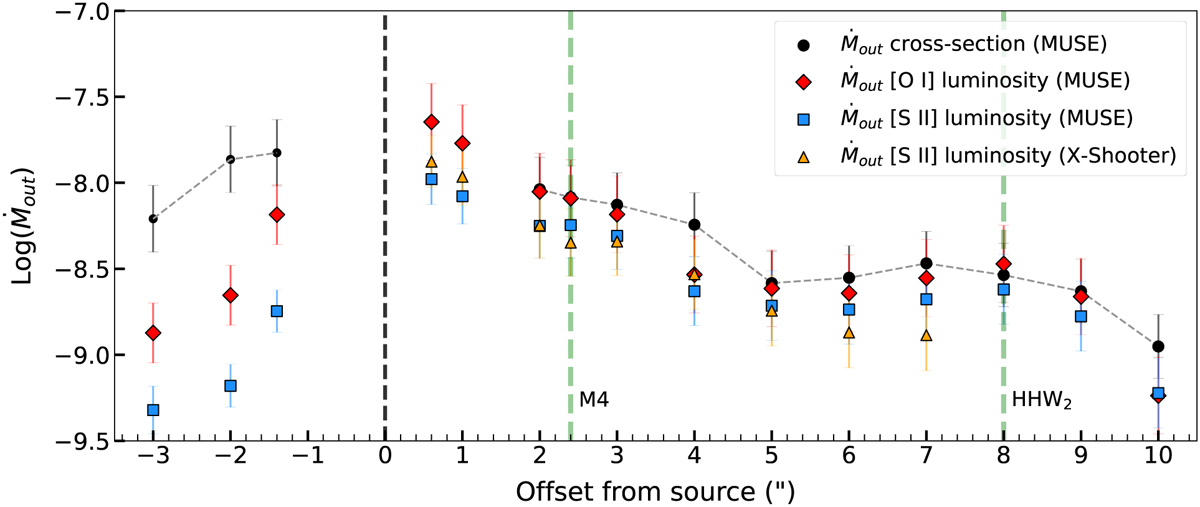
Mass outflow rates through the jets obtained with MUSE and X-shooter. Knot positions are marked with green dashed lines and the source position is marked by the black dashed line. The inner two spatial positions (<2″ of the source) are excluded from the cross-sectional estimate in the red-shifted lobe since the jet width is unresolved in this region.
Current usage metrics show cumulative count of Article Views (full-text article views including HTML views, PDF and ePub downloads, according to the available data) and Abstracts Views on Vision4Press platform.
Data correspond to usage on the plateform after 2015. The current usage metrics is available 48-96 hours after online publication and is updated daily on week days.
Initial download of the metrics may take a while.