Fig. 12
Download original image
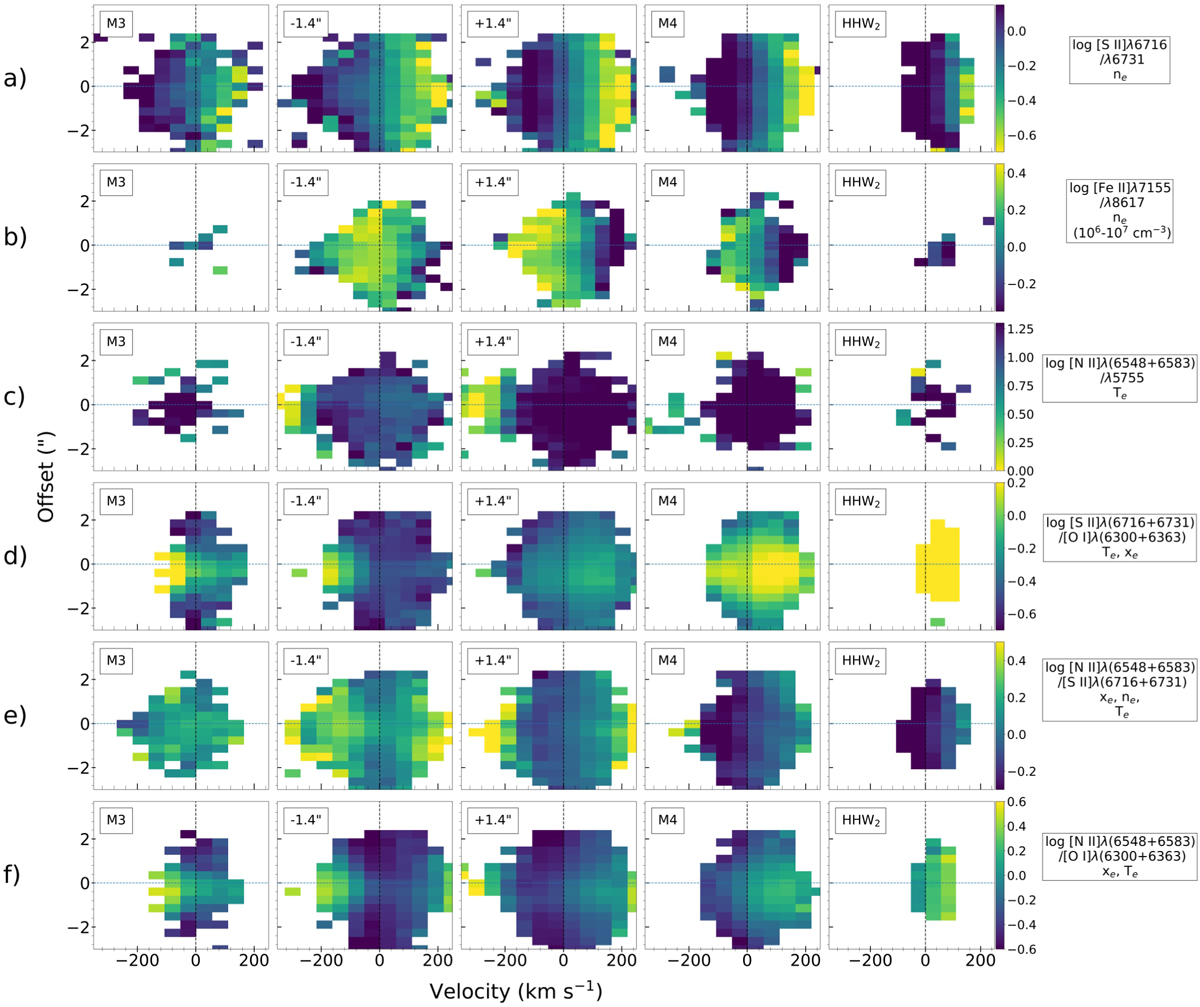
Transverse PV maps across the Th 28 jets, sampled from the MUSE data at knot positions and at ±1.4″ from the source position (close to the jet base). The maps are binned across 1″ sections along the jet axis and colour bars are as in Fig. 5. Rows a and b show the [S II]λλ 6716/6731 and [Fe II]λλ 7155/8617 ratios, both primarily sensitive to electron density ne. The remaining rows are as follows: c, [N II]λ(6548+6583)/5755 tracing electron temperature Te; d, [S II]λ(6716+6731)/[O I]λ(6300+6363) tracing Te and the ionisation fraction xe; e, [N II]λ(6548+6583)/[S II]λ(6716+6731) tracing xe, ne and Te and f, [N II]λ(6548+6583)/[O I]λ(6300+6363) tracing xe and Te.
Current usage metrics show cumulative count of Article Views (full-text article views including HTML views, PDF and ePub downloads, according to the available data) and Abstracts Views on Vision4Press platform.
Data correspond to usage on the plateform after 2015. The current usage metrics is available 48-96 hours after online publication and is updated daily on week days.
Initial download of the metrics may take a while.