Fig. 8
Download original image
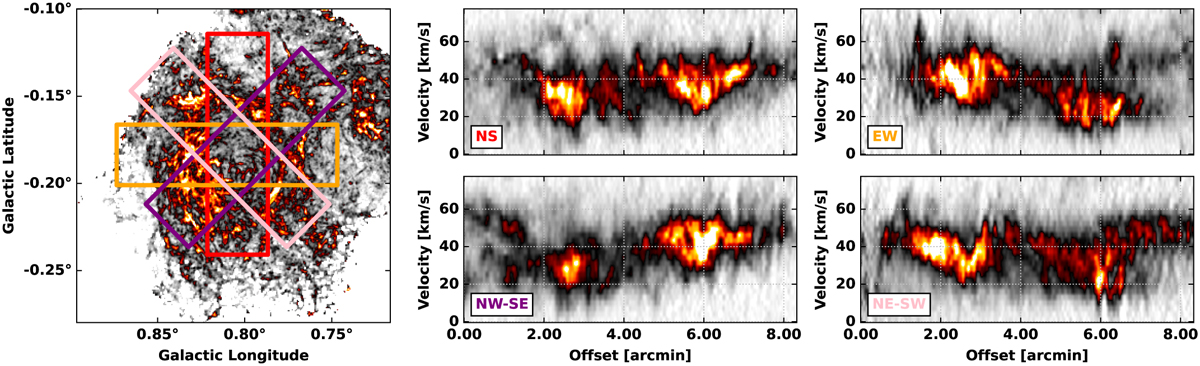
HNCO PV plots. Left panel: maximum intensity HNCO(4–3) map from the ACES survey. Overlaid are four rectangles showing the area over which the PV cuts were performed. Right panels: PV plots for four cuts through the ring-like structure. The cuts were performed from north to south (NS, red), east to west (EW, orange), north-west to south-east (NW-SE, purple), and north-east to south-west (NE-SW, pink).
Current usage metrics show cumulative count of Article Views (full-text article views including HTML views, PDF and ePub downloads, according to the available data) and Abstracts Views on Vision4Press platform.
Data correspond to usage on the plateform after 2015. The current usage metrics is available 48-96 hours after online publication and is updated daily on week days.
Initial download of the metrics may take a while.