Fig. 6
Download original image
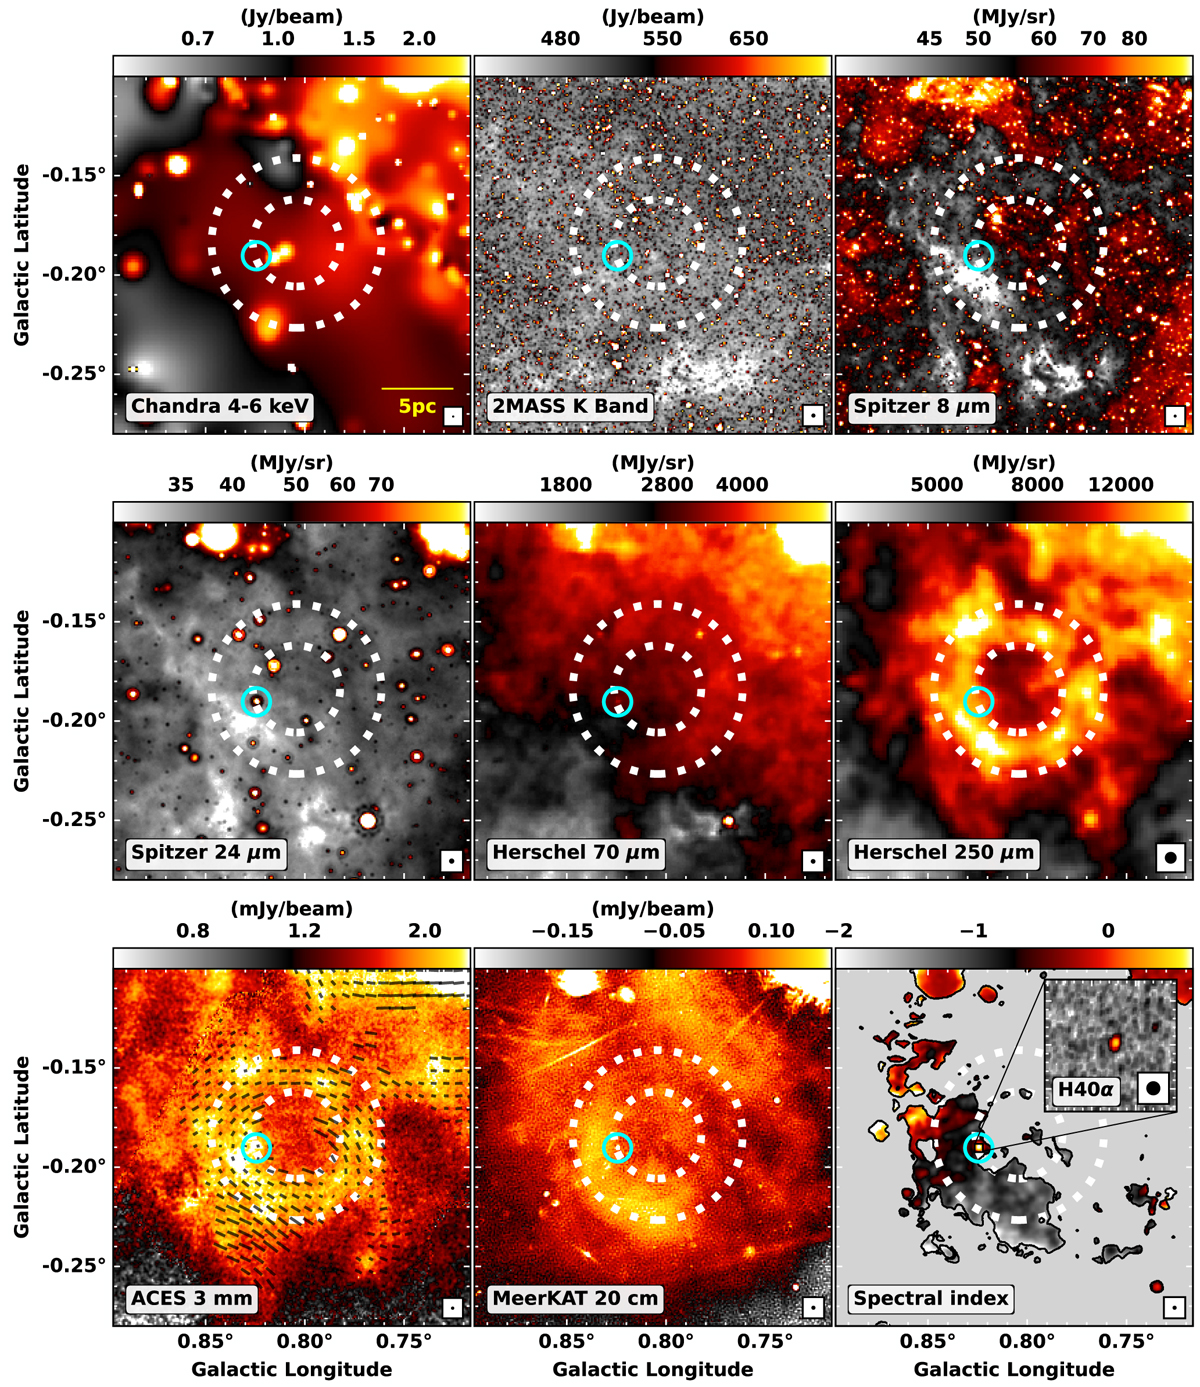
Multi-wavelength view of the M0.8–0.2 ring. The dotted white circles in each panel show the approximate extent of the Herschel 250 μm continuum emission of the ring. The cyan circle marks the position of the H II region discussed in Sect. 4.1. Top row, left to right: Chandra 4–6 keV emission (Wang 2021), 2MASS K-band observations (Skrutskie et al. 2006), and Spitzer 8 μm observations from the GLIMPSE survey (Churchwell et al. 2009). Middle row, left to right: Spitzer MIPSGAL 24 μm (Carey et al. 2009) and Herschel 70 and 250 μm observations (Molinari et al. 2010). Bottom row, left to right: 3 mm continuum emission from the ACES survey (12 m combined with GBT+Planck from Ginsburg et al. 2020), 20 cm emission observed by MeerKAT, and the MeerKAT spectral index map, with a zoomed-in view of the peak H40α emission at the location of the H II region overlaid. In the 3 mm continuum image, magnetic field pseudo-vectors from the FIREPLACE polarimetry survey are overlaid (polarisation vectors rotated by 90 degrees, as the direction of the polarised electric field measured in the infrared is considered to be perpendicular to that of the magnetic field; Butterfield et al. 2024a,b). The beam sizes of the observations are shown with a circle in the lower-right corner of each panel, with the FWHMs as follows (proceeding from left to right and top to bottom, and finishing with the H40α image): 0.5, 4, 2, 6, 5, 18, 2.5, 4, 4, and 1.4″. A scale bar of 5 pc is displayed in yellow on the Chandra image.
Current usage metrics show cumulative count of Article Views (full-text article views including HTML views, PDF and ePub downloads, according to the available data) and Abstracts Views on Vision4Press platform.
Data correspond to usage on the plateform after 2015. The current usage metrics is available 48-96 hours after online publication and is updated daily on week days.
Initial download of the metrics may take a while.