Fig. 5
Download original image
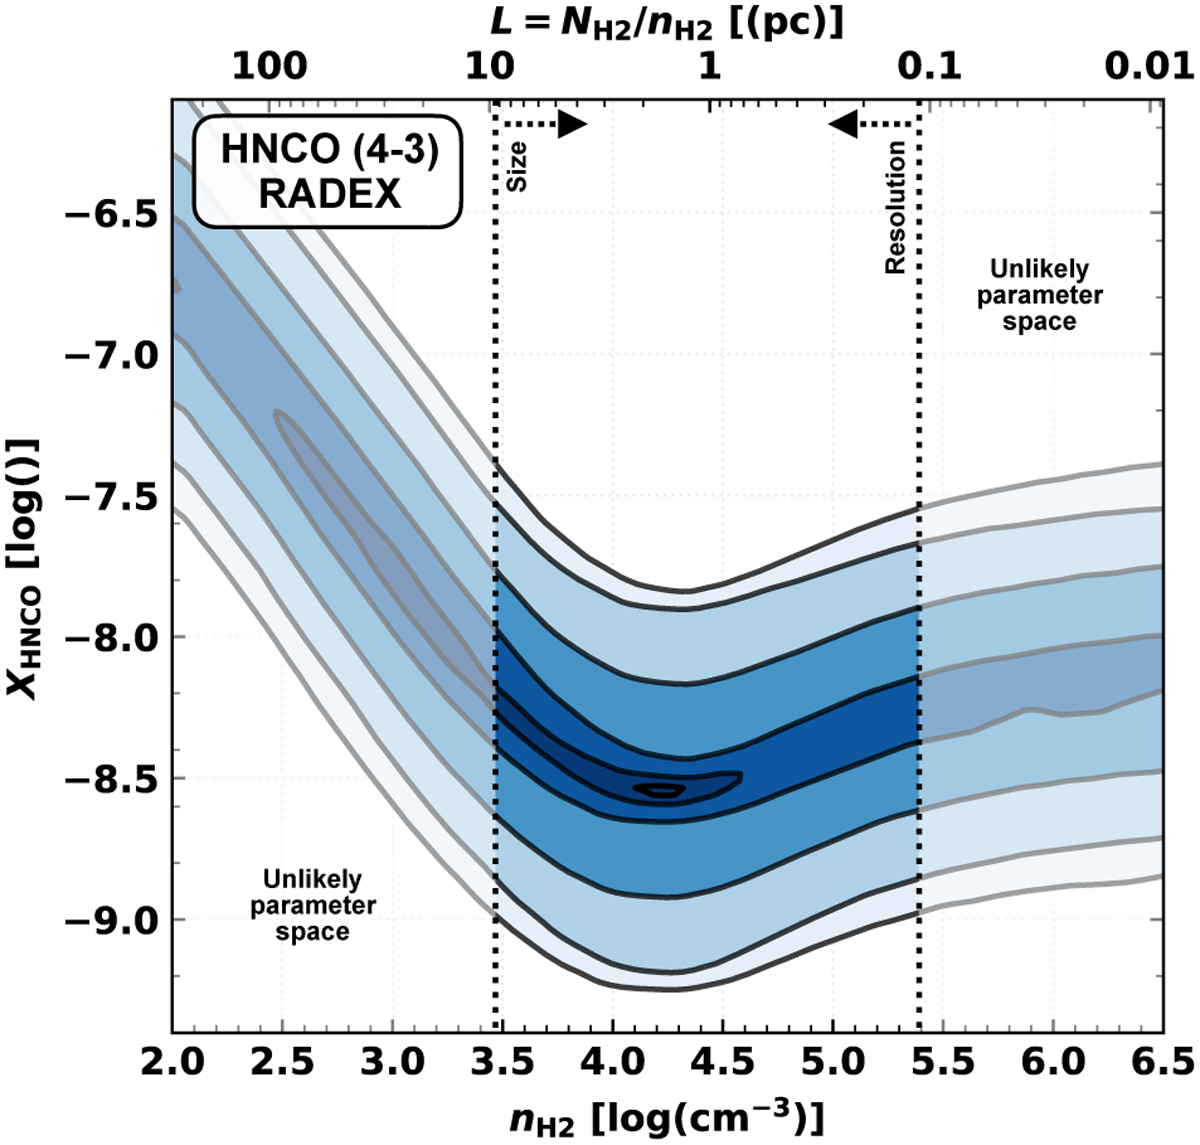
Radiative transfer modelling of the HNCO (4–3) emission. We demonstrate the likelihood of achieving the observed intensities (1 to 5 K) from a grid of models. This plot shows contours at the 10, 25, 50, 75, 90, and 95 per cent likelihoods of achieving the observed brightness temperatures, through varying the Tkin, line width, and HNCO abundance. On the upper y-axis, we show the predicted depth calculated from the column and number densities ![]() . The vertical dashed lines show the angular resolution of the observations and the measured size of the ring-like structure, which we use as upper and lower bounds to constrain the parameter space. We find a peak likelihood of
. The vertical dashed lines show the angular resolution of the observations and the measured size of the ring-like structure, which we use as upper and lower bounds to constrain the parameter space. We find a peak likelihood of ![]() , with a large spread in plausible densities between 103.5 and 105.5 cm−3.
, with a large spread in plausible densities between 103.5 and 105.5 cm−3.
Current usage metrics show cumulative count of Article Views (full-text article views including HTML views, PDF and ePub downloads, according to the available data) and Abstracts Views on Vision4Press platform.
Data correspond to usage on the plateform after 2015. The current usage metrics is available 48-96 hours after online publication and is updated daily on week days.
Initial download of the metrics may take a while.