Fig. 3
Download original image
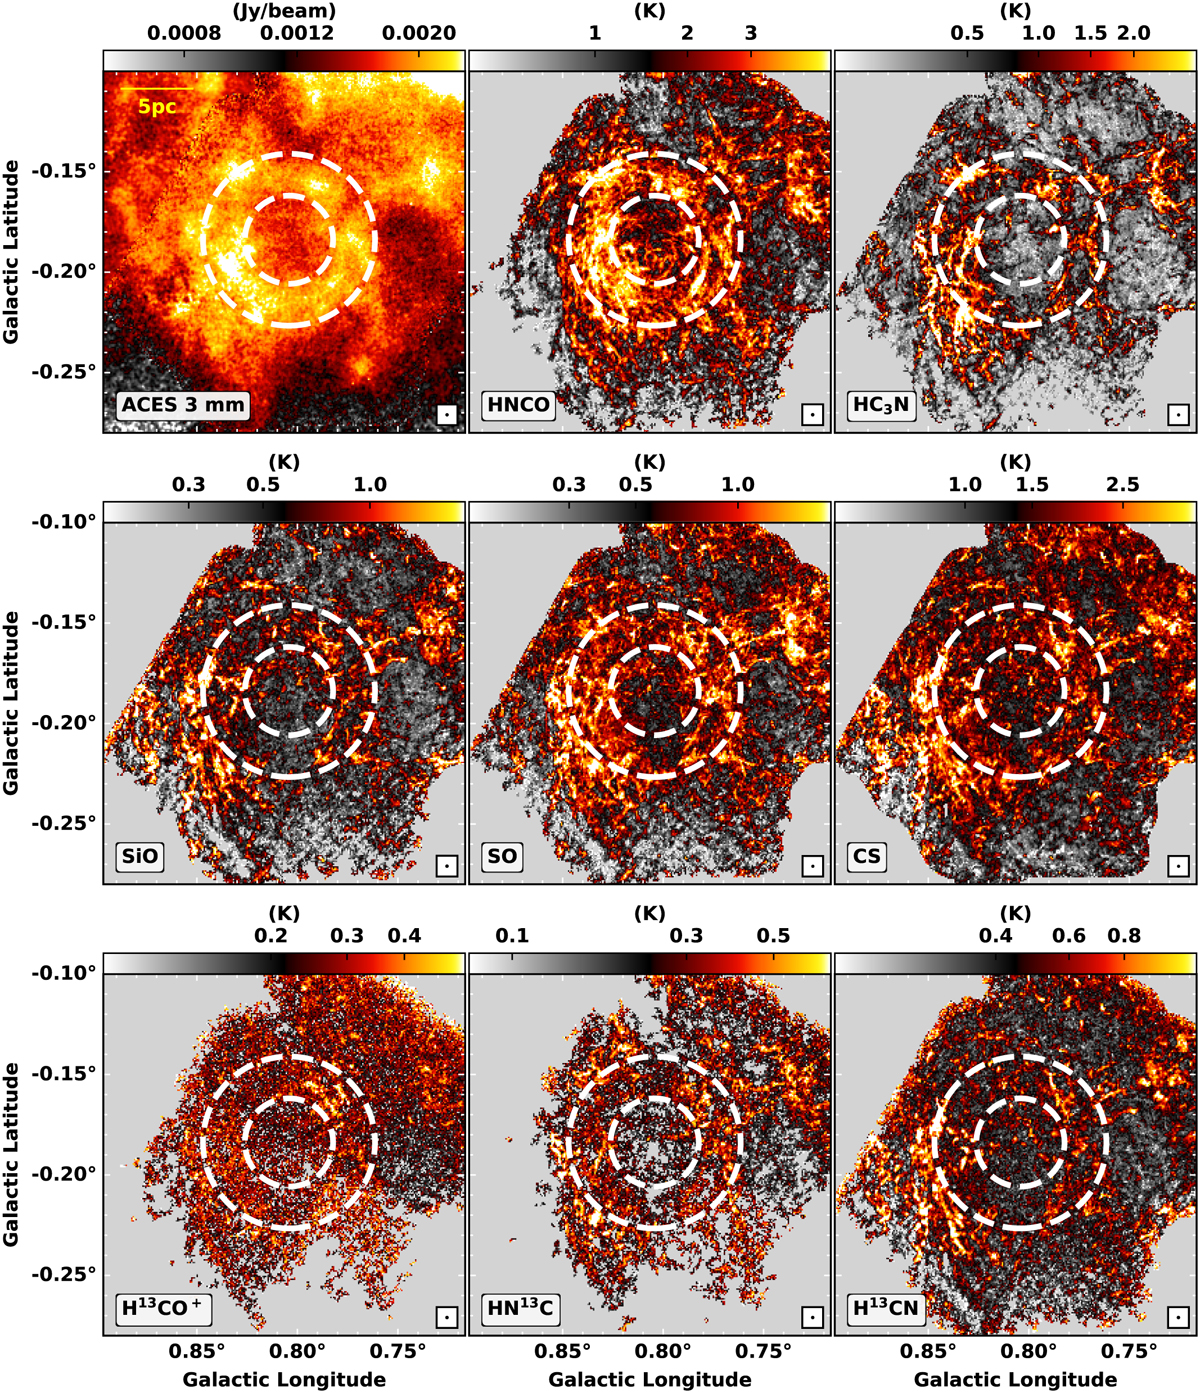
View of the M0.8–0.2 ring from the ACES survey. The top left image shows the 3 mm continuum emission from the ACES survey (12 m combined with GBT + Planck from Ginsburg et al. 2020). The remaining panels show the maximum intensity of the spectral transitions in Table A.1, determined within the velocity range −5 to 75 km s−1. The cubes were masked with a mask determined by growing a low (2 RMS) noise threshold mask into a high (5 RMS) noise threshold mask, and ensuring that this final mask had a continuity of at least one pixel on each side channel. The final masked cubes used to produce the peak intensity images shown will therefore have signal in both the extended lower signal-to-noise pixels and the brightest peaks. The size of the beam of each observation is shown with a circle in the lower-right corner of each image. A scale bar of 5 pc is displayed in yellow on the continuum image. The dashed white circles show the approximate extent of the Herschel 250 μm continuum emission of the ring-like structure.
Current usage metrics show cumulative count of Article Views (full-text article views including HTML views, PDF and ePub downloads, according to the available data) and Abstracts Views on Vision4Press platform.
Data correspond to usage on the plateform after 2015. The current usage metrics is available 48-96 hours after online publication and is updated daily on week days.
Initial download of the metrics may take a while.