Fig. 2
Download original image
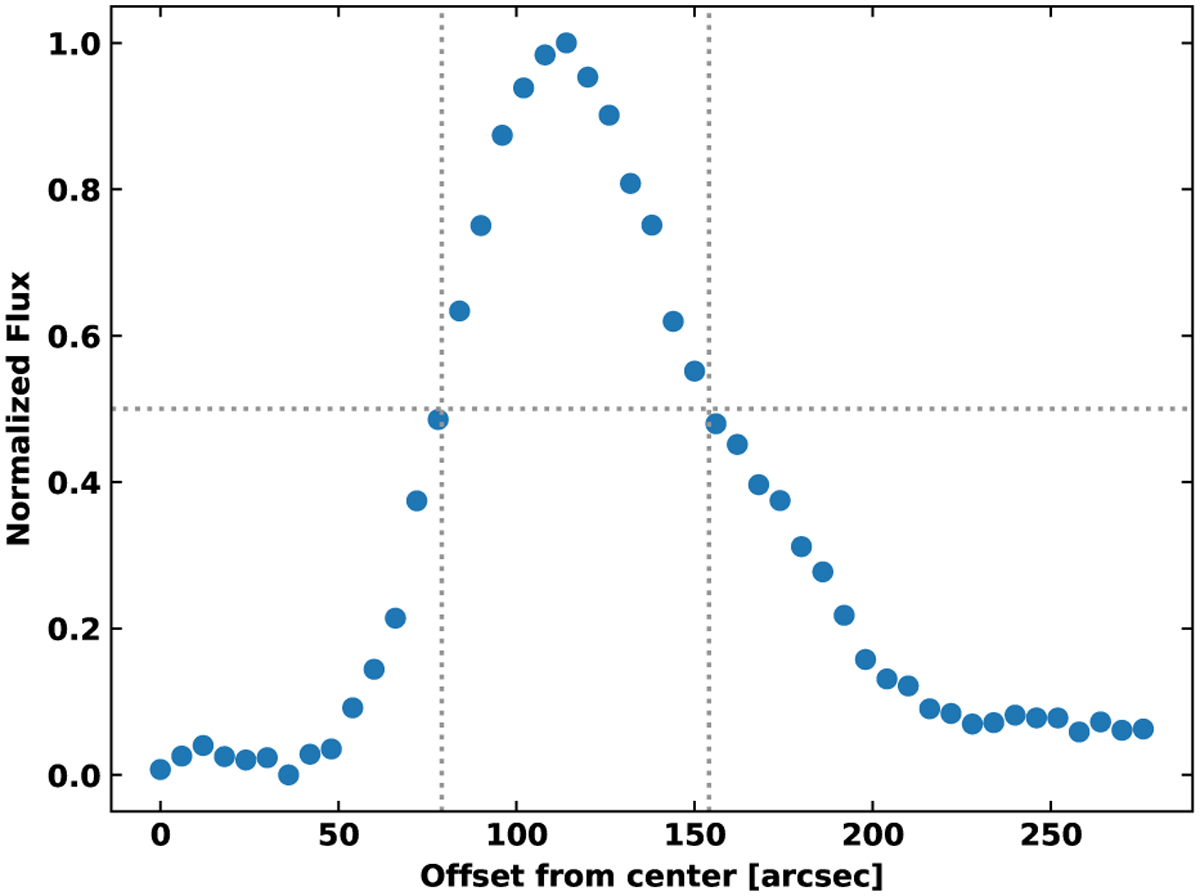
Radial profile from Herschel 250 μm emission. The mean flux contained in annuii of increasing radius is plotted, normalised against the peak value. The annuii are defined outwards from the centre of the M0.8–0.2 ring (![]() and
and ![]() ) with a thickness of one pixel. The overlaid vertical grey lines define the radii between which the normalised mean flux is above the threshold of 0.5, indicated by the horizontal grey line.
) with a thickness of one pixel. The overlaid vertical grey lines define the radii between which the normalised mean flux is above the threshold of 0.5, indicated by the horizontal grey line.
Current usage metrics show cumulative count of Article Views (full-text article views including HTML views, PDF and ePub downloads, according to the available data) and Abstracts Views on Vision4Press platform.
Data correspond to usage on the plateform after 2015. The current usage metrics is available 48-96 hours after online publication and is updated daily on week days.
Initial download of the metrics may take a while.