Fig. 1
Download original image
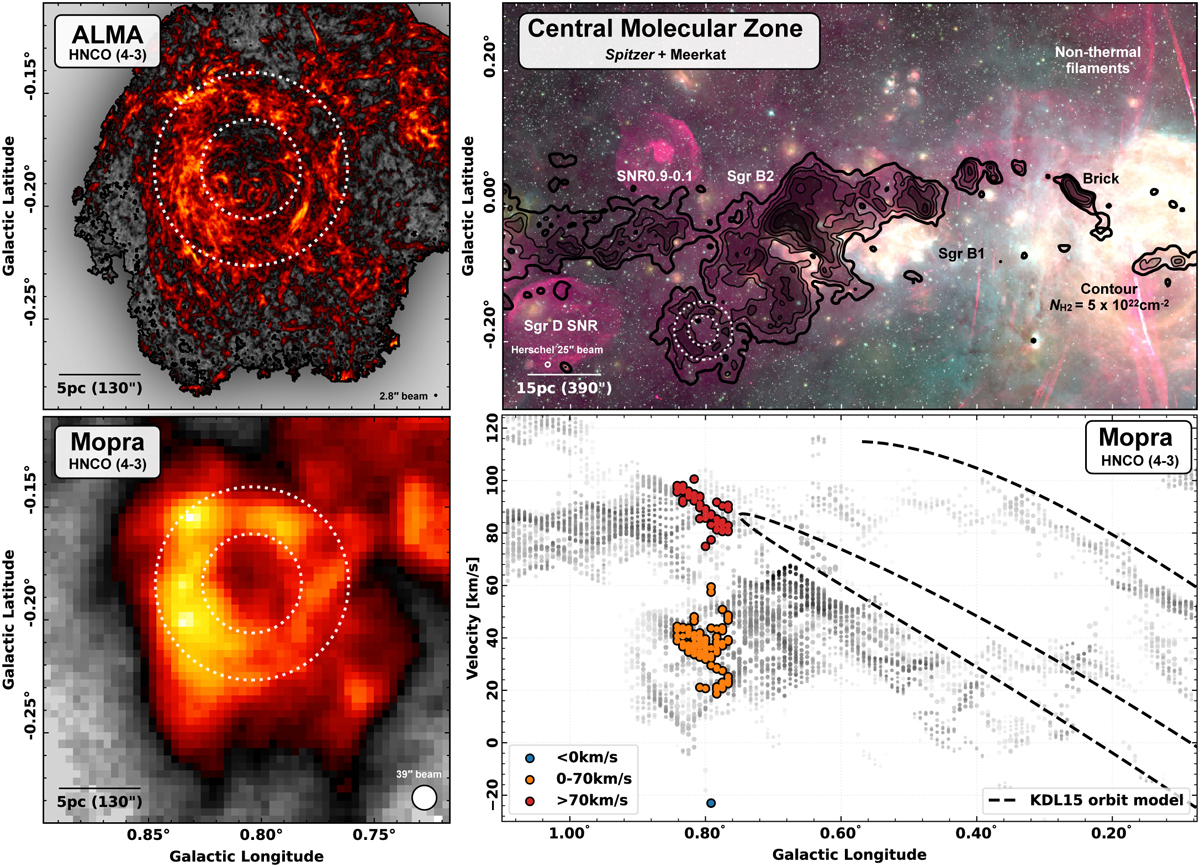
Overview of the M0.8–0.2 ring within the CMZ. Upper-left panel: HNCO (4–3) peak intensity map (12 m, 7 m, and total power array data combined) from ACES towards the M0.8–0.2 ring. The colour scale extends from 0.2 to 8.0 K in square root stretch. The dotted white circles show the approximate extent of the Berschel 250 μm continuum emission of the ring-like structure. The ALMA beam size of 2.8″ is shown in the lower right, and a scale bar of 5 pc is shown in the lower left of the panel. Lower-left panel: HNCO (4–3) emission from the Mopra telescope (Jones et al. 2012). The Mopra beam size of 39″ is shown in the lower right of the panel. Upper-right panel: multi-wavelength view of part of the CMZ. We show a three-colour composite of 8 μm emission from the Spitzer GLIMPSE survey (green; Churchwell et al. 2009), 24 μm emission from the Spitzer MIPSGAL survey (yellow; Carey et al. 2009), and 20 cm emission observed by MeerKAT (red; Heywood et al. 2019, 2022) and the GBT (red; Law et al. 2008). Overlaid as black contours are the total molecular gas column densities at levels of 5, 7.5, 10, 15, 25, and 50 × 1022 cm−2 (Battersby et al., in prep.) calculated using data from the Herschel Hi-GAL survey (Molinari et al. 2010). Also overlaid are a number of interesting features in the Galactic Centre and the dotted white circles highlighting the ring-like structure (identical to the left panels). The Herschel beam size of 25″ and a scale bar of 15 pc are shown in the lower left of the panel. Lower-right panel: PV diagram of the Mopra HNCO (4–3) emission (Henshaw et al. 2016). Each point corresponds to the longitude and centroid velocity of a Gaussian component of the HNCO emission, extracted using SCOUSE (Henshaw et al. 2016). The emission at the position of the ring-like structure is highlighted with three different colours, corresponding to the velocity ranges <0 km s−1 (blue), 0–70 km s−1 (orange), and >70 km s−1 (red). The orange dots correspond to the M0.8–0.2 ring, while the blue and red dots relate to additional line-of-sight material. The orbital model of Kruijssen et al. (2015) is overlaid as a dashed black line.
Current usage metrics show cumulative count of Article Views (full-text article views including HTML views, PDF and ePub downloads, according to the available data) and Abstracts Views on Vision4Press platform.
Data correspond to usage on the plateform after 2015. The current usage metrics is available 48-96 hours after online publication and is updated daily on week days.
Initial download of the metrics may take a while.