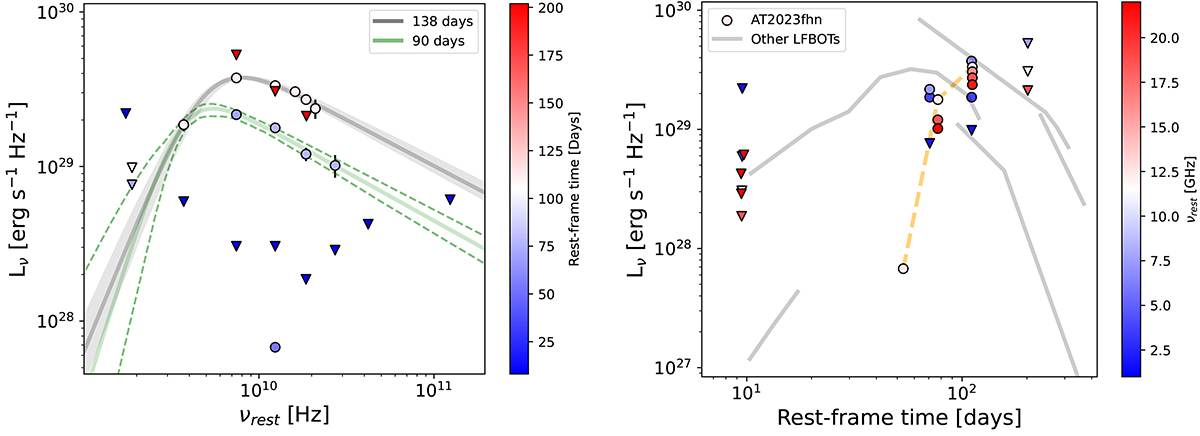
Fig. 9.
Download original image
Radio observations of AT 2023fhn (see Table A.3) placed in the context of other LFBOTs. Upper limits from NOEMA and the VLA as reported by Ho et al. (2023d) and Ho (2023) are also shown. Left: radio SED for AT 2023fhn, with a broken-power law fit to the t = 138 day (grey line) and t = 90 day (green line) data. Data point rest-frame times are indicated by the colourbar. The 90% confidence regions on the fits are shown by light grey shading (138 days) and dashed green lines (90 days). It is important to note that there are overlapping data points at ∼3 Ghz (i.e. a 90 day point with similar luminosity is obscured by the 138 day point). Right: radio light curve for AT 2023fhn (central frequencies indicated by the colourbar) and other LFBOTs. The 10 GHz AT 2023fhn detections are connected by a dashed orange line, to aid the eye in comparing with other LFBOTs. Data for the other LFBOTs, all at (10 ± 2) GHz, are from Ho et al. (2019; 2019, AT 2018cow), Ho et al. (2020, ZTF 18abvkwla), Coppejans et al. (2020, CSS161010), Bright et al. (2022), Ho et al. (2022, ZTF 20 acigmel) and Yao et al. (2022, AT 2020mrf).
Current usage metrics show cumulative count of Article Views (full-text article views including HTML views, PDF and ePub downloads, according to the available data) and Abstracts Views on Vision4Press platform.
Data correspond to usage on the plateform after 2015. The current usage metrics is available 48-96 hours after online publication and is updated daily on week days.
Initial download of the metrics may take a while.