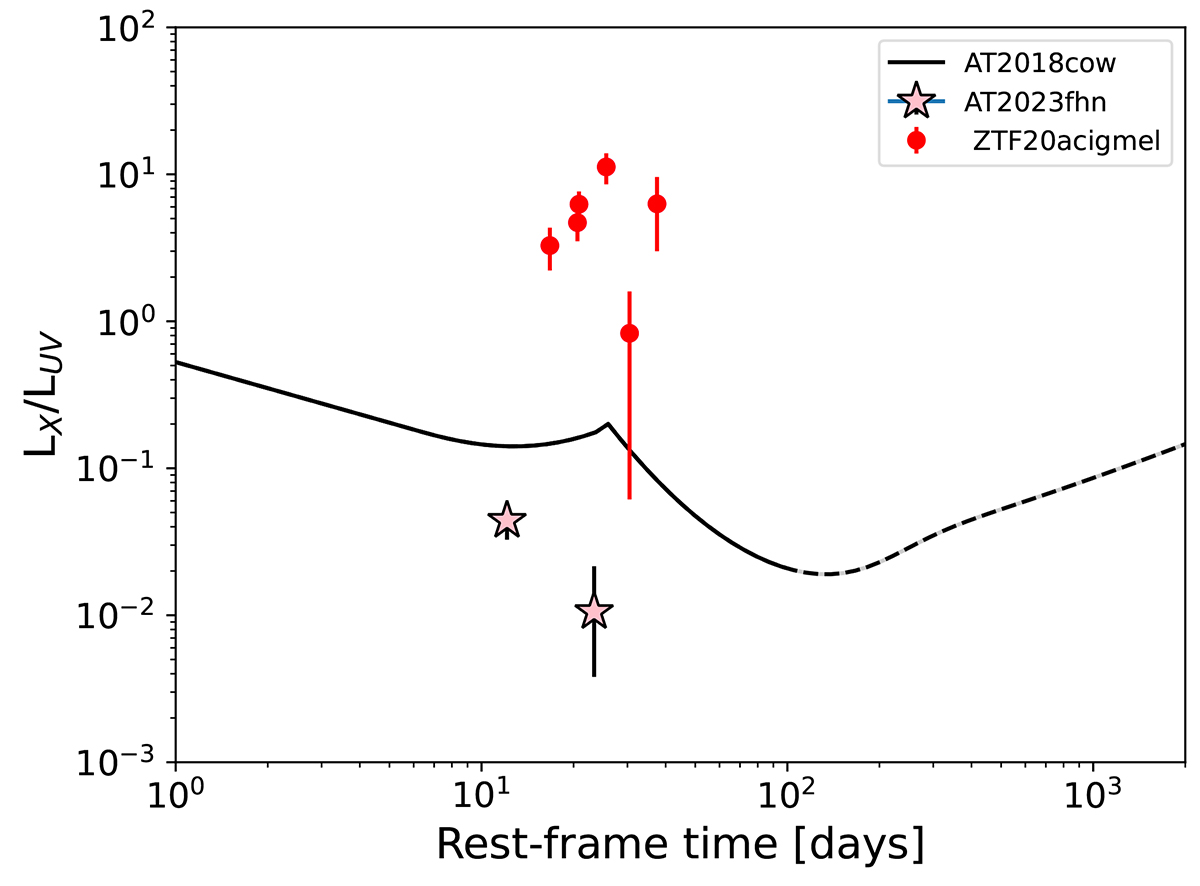
Fig. 8.
Download original image
Ratio of X-ray to UV luminosity for LFBOTs AT 2023fhn, AT 2018cow, and ZTF 20acigmel. The AT 2023fhn points use the dashed orange line in Fig. 6 and the two Chandra X-ray detections (errorbars reflect the X-ray uncertainties only). The black curve is the ratio of the Migliori et al. (2024) X-ray light-curve fit (see the solid black line, Fig. 7) and a broken power-law fit to the UV observations (the solid black line in Fig. 6). The small k-corrections are neglected in this comparison. The evolution past 200 days (drawn as a dashed line) is highly uncertain due to the sole X-ray detection. The ZTFacigmel data are from Ho et al. (2022), Bright et al. (2022), where we have taken the ratio of X-ray points and the power-law fit to the ZTFacigmel UV light curve in Fig. 6. The uncertainties on these points again solely reflect the X-ray measurement uncertainties.
Current usage metrics show cumulative count of Article Views (full-text article views including HTML views, PDF and ePub downloads, according to the available data) and Abstracts Views on Vision4Press platform.
Data correspond to usage on the plateform after 2015. The current usage metrics is available 48-96 hours after online publication and is updated daily on week days.
Initial download of the metrics may take a while.