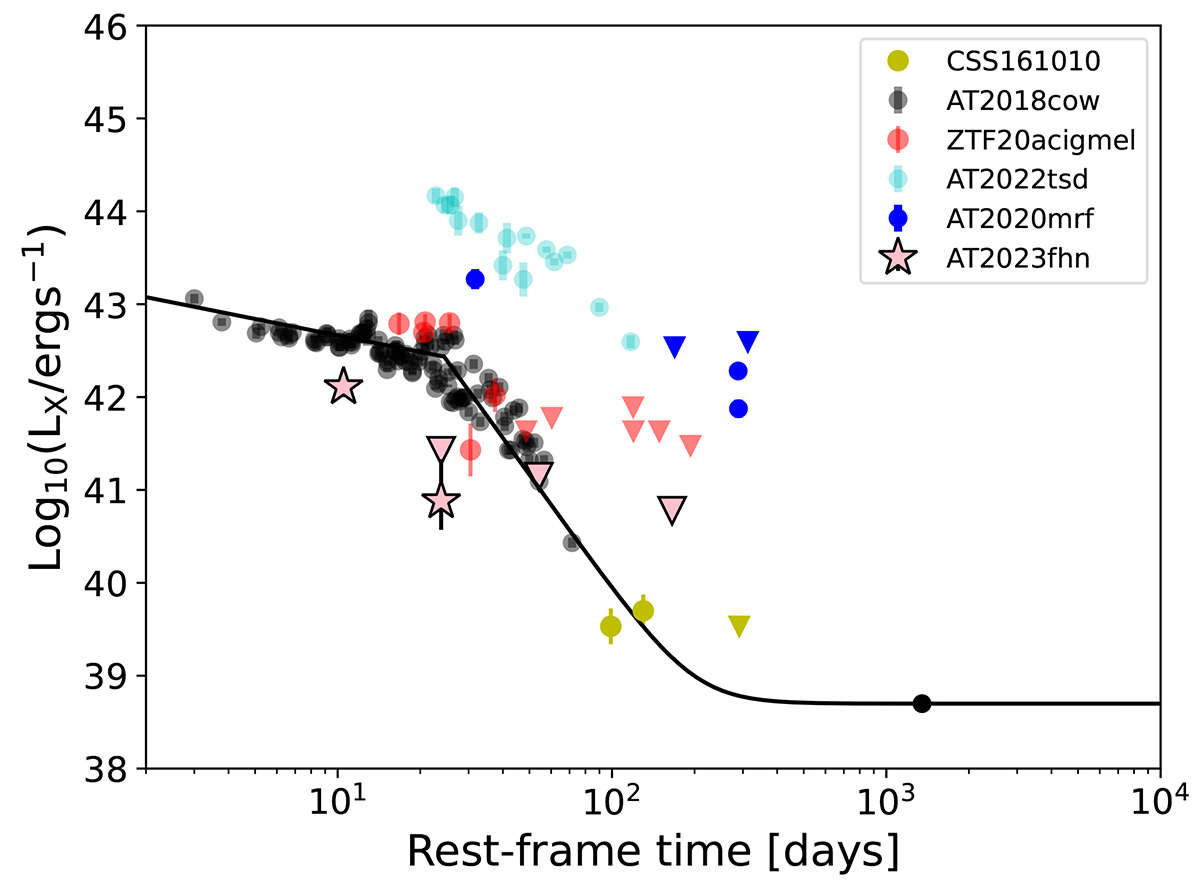
Fig. 7.
Download original image
X-ray light curve of AT 2023fhn compared with other LFBOTs. All data are in the ∼0.5–10 keV range, are unabsorbed and from Rivera Sandoval et al. (2018; 2019; 2024, AT 2018cow), Coppejans et al. (2020, CSS161010), Bright et al. (2022; 2022, ZTF 20acigmel), Yao et al. (2022, AT 2020mrf) and Matthews et al. (2023, AT 2022tsd). Given the marginal nature of the second AT 2023fhn measurement, we also plot the 2σ upper limit at this epoch. A broken-power law and late-time plateau interpretation of AT 2018cow’s light curve is shown by the solid black line (Migliori et al. 2024).
Current usage metrics show cumulative count of Article Views (full-text article views including HTML views, PDF and ePub downloads, according to the available data) and Abstracts Views on Vision4Press platform.
Data correspond to usage on the plateform after 2015. The current usage metrics is available 48-96 hours after online publication and is updated daily on week days.
Initial download of the metrics may take a while.