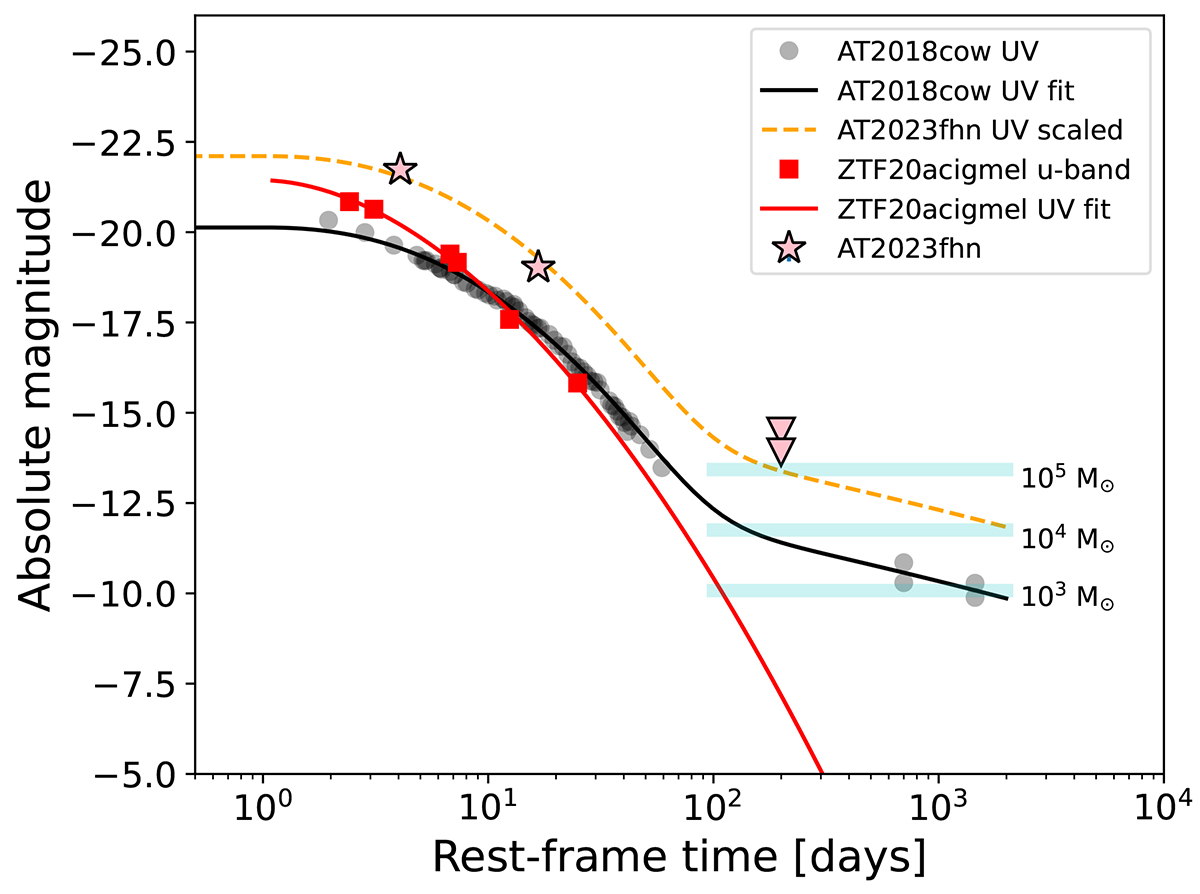
Fig. 6.
Download original image
UV data points for AT 2023fhn, compared with the UV light curves of AT 2018cow (Early u-band and late-time F222W and F336W, Prentice et al. 2018; Perley et al. 2019; Inkenhaag et al. 2023) and ZTF 20acigmel (Perley et al. 2021). A light-curve fit to the AT 2018cow data is increased in luminosity to intercept the sole early-time AT 2023fhn UV point, the subsequent F336W limit at ∼112 rest-frame days lies just above the expected UV magnitude at this epoch, assuming identical evolution to the Cow. A similar fit is made for the early-time ZTF 20acigmel points. Cyan horizontal bands show the expected UV absolute magnitudes at late times for accretion discs around IMBHs of different masses, following a tidal disruption event (Mummery et al. 2024).
Current usage metrics show cumulative count of Article Views (full-text article views including HTML views, PDF and ePub downloads, according to the available data) and Abstracts Views on Vision4Press platform.
Data correspond to usage on the plateform after 2015. The current usage metrics is available 48-96 hours after online publication and is updated daily on week days.
Initial download of the metrics may take a while.