Fig. 10.
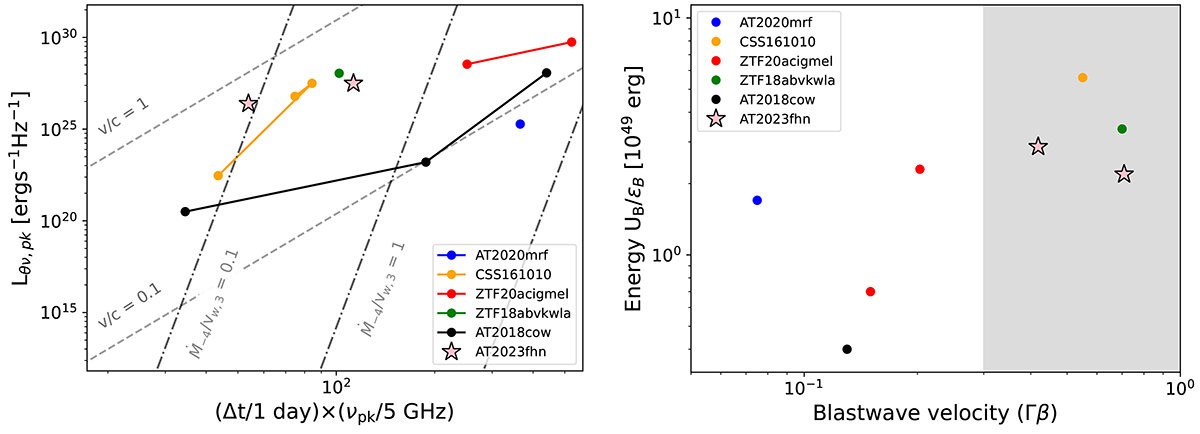
Download original image
Results from fitting a synchrotron blast wave model to AT2023fhn. Left: the product of rest-time Δt and the rest-frame peak frequency νpk at that time, versus the peak radio spectral luminosity Lθν, pk = Lν, pk/(1 + z)3, with lines of constant Ṁ/Vw (in units of 10−4 M⊙ yr−1/1000 km s−1) and lower limits on the blast-wave velocity shown. Both AT 2023fhn epochs are shown, we note that constraints on the later point (138 days) are stronger and the parameters at this epoch better constrained. All comparison data points adopt ϵe = ϵB = 1/3. Right: lower limits on the average blast-wave velocity (blast-wave radius over the rest-frame time) in units of c versus the internal energy of the shock U = UB/ϵB. Other LFBOT data are taken from Ho et al. (2019; 2019; 2021, AT 2018cow), Ho et al. (2020, ZTF 18abvkwla), Coppejans et al. (2020, CSS161010), Bright et al. (2022), Ho et al. (2022, ZTF 20 acigmel) and Yao et al. (2022, AT 2020mrf). The mildly relativistic regime is shaded. We have scaled the Bright et al. (2022) ZTF 20 acigmel point following Eqs. (2) and (6) to align with our assumption of equipartition.
Current usage metrics show cumulative count of Article Views (full-text article views including HTML views, PDF and ePub downloads, according to the available data) and Abstracts Views on Vision4Press platform.
Data correspond to usage on the plateform after 2015. The current usage metrics is available 48-96 hours after online publication and is updated daily on week days.
Initial download of the metrics may take a while.