Fig. 9
Download original image
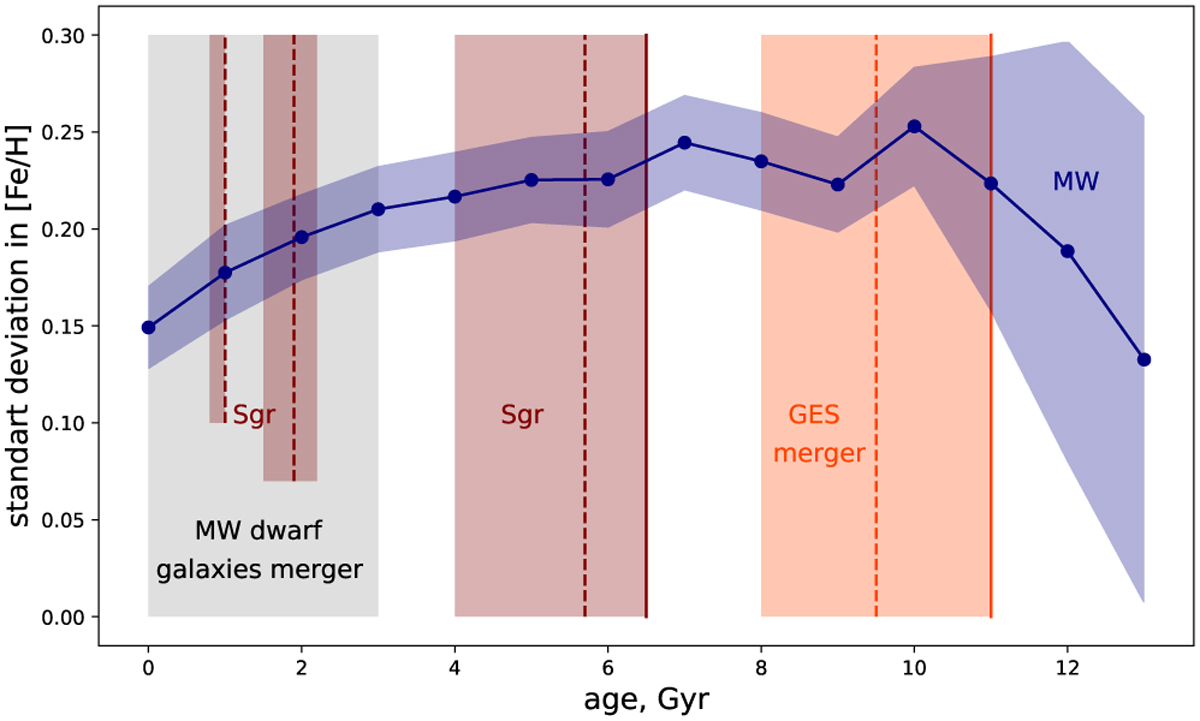
Metallicity standard deviation vs. age trend of the stars under investigation (blue line for- main trend; blue region for measurement uncertainty Sect. 3.1). Orange: GES accretion event (observations: Ruiz-Lara et al. (2020); Gondoin (2023); Lu et al. (2024); Ratcliffe et al. (2023); Anders et al. (2023), numerical simulations: Laporte et al. (2019); Belokurov et al. (2018); Helmi et al. (2018); Buck et al. (2023); Wang et al. (2024)); red: Sgr (Ruiz-Lara et al. 2020); gray: mergers of the Milky Way dwarf galaxies (Wang et al. 2024). The solid vertical lines show the beginning of the merger, and the dashed vertical lines show the peak of star formation corresponding to a particular accretion event.
Current usage metrics show cumulative count of Article Views (full-text article views including HTML views, PDF and ePub downloads, according to the available data) and Abstracts Views on Vision4Press platform.
Data correspond to usage on the plateform after 2015. The current usage metrics is available 48-96 hours after online publication and is updated daily on week days.
Initial download of the metrics may take a while.