Fig. 6
Download original image
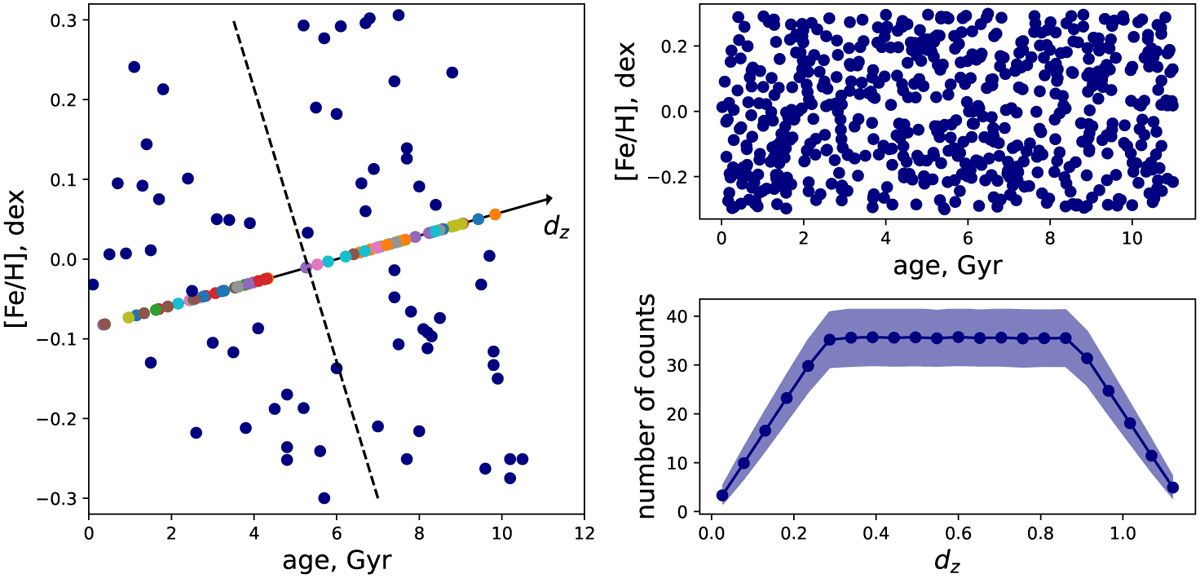
Illustration of method used to test the separation in the age-metallicity map. Left: age-metallicity map of Nissen’s data (blue dots) with the division line for two populations (black dashed line) and with dz parameter axes (black solid line). The solar twins projected across the dz axis (colored points). Upper right: random distribution of 600 stars. Lower right: projection of the data from the upper right age-metallicity map to the dz axis.
Current usage metrics show cumulative count of Article Views (full-text article views including HTML views, PDF and ePub downloads, according to the available data) and Abstracts Views on Vision4Press platform.
Data correspond to usage on the plateform after 2015. The current usage metrics is available 48-96 hours after online publication and is updated daily on week days.
Initial download of the metrics may take a while.