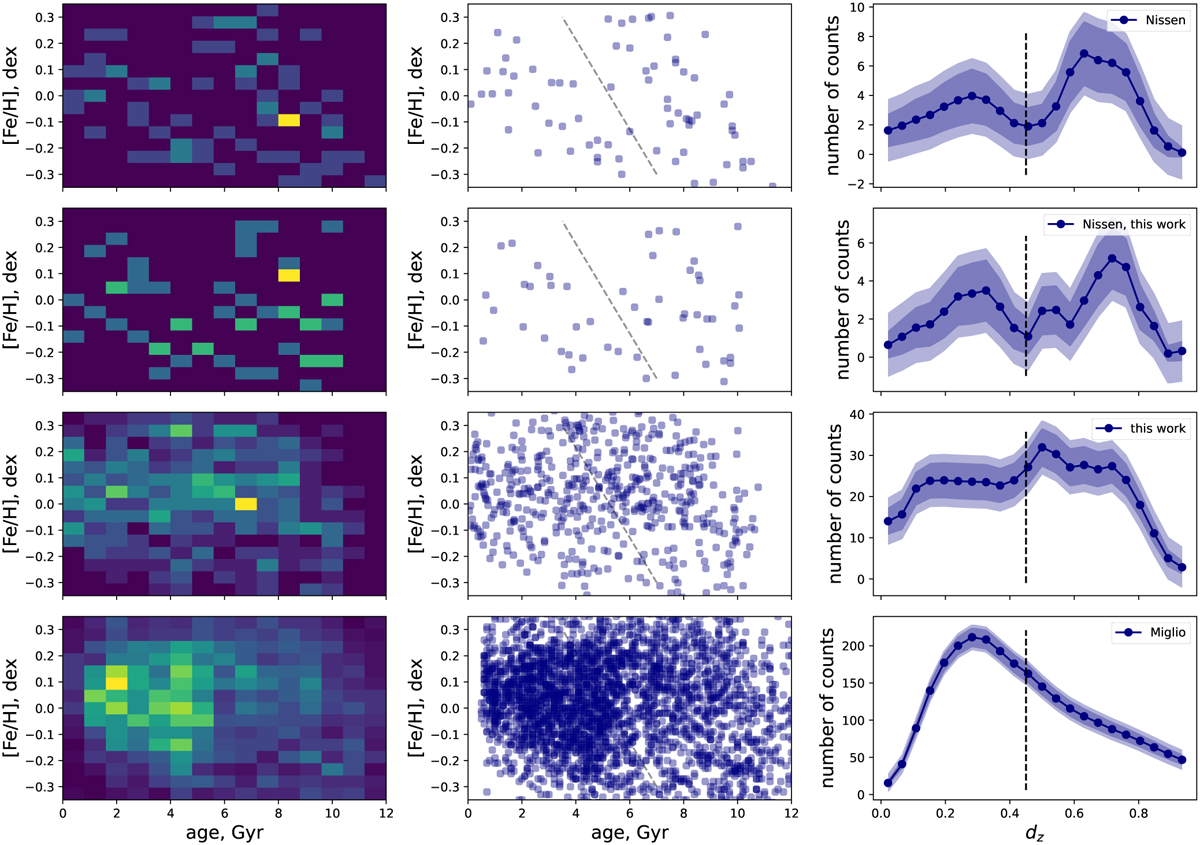
Fig. 4
Download original image
AMR for three different datasets: [1] Nissen’s dataset (72 stars, top row), [2] stars that we analyzed from Nissen’s dataset (52 stars, second row), [3] dataset under investigation in this work (485 stars, third row), [4] dataset from Miglio et al. (2021) (2785 stars, bottom row). The right column represents the dz separation parameter (Sect. 3.1) where the vertical dashed line represents the location of the Nissen’s data drop, the dark blue region is the measurement uncertainty, and the light blue region is the quadratic sum of measurement and statistical uncertainty.
Current usage metrics show cumulative count of Article Views (full-text article views including HTML views, PDF and ePub downloads, according to the available data) and Abstracts Views on Vision4Press platform.
Data correspond to usage on the plateform after 2015. The current usage metrics is available 48-96 hours after online publication and is updated daily on week days.
Initial download of the metrics may take a while.