Fig. 3
Download original image
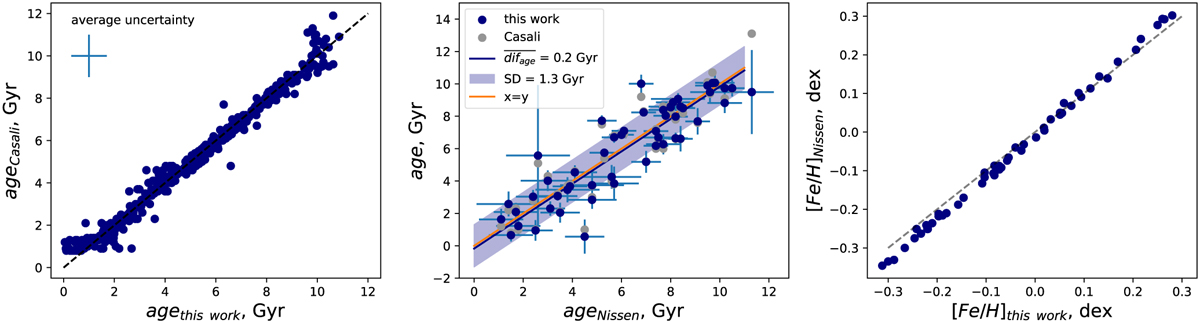
Comparison of age and metallicity derived by different methods. Left: comparison of age derived in this work and in Casali et al. (2020). Middle: comparison of age derived in this work and in Nissen et al. (2020) (blue circles), its mean difference ![]() , and standard deviation (SD); comparison of age derived in Casali et al. (2020) and in Nissen et al. (2020) (gray circles). Right: comparison of metallicity derived in this work and in Nissen et al. (2020).
, and standard deviation (SD); comparison of age derived in Casali et al. (2020) and in Nissen et al. (2020) (gray circles). Right: comparison of metallicity derived in this work and in Nissen et al. (2020).
Current usage metrics show cumulative count of Article Views (full-text article views including HTML views, PDF and ePub downloads, according to the available data) and Abstracts Views on Vision4Press platform.
Data correspond to usage on the plateform after 2015. The current usage metrics is available 48-96 hours after online publication and is updated daily on week days.
Initial download of the metrics may take a while.