Fig. 9.
Download original image
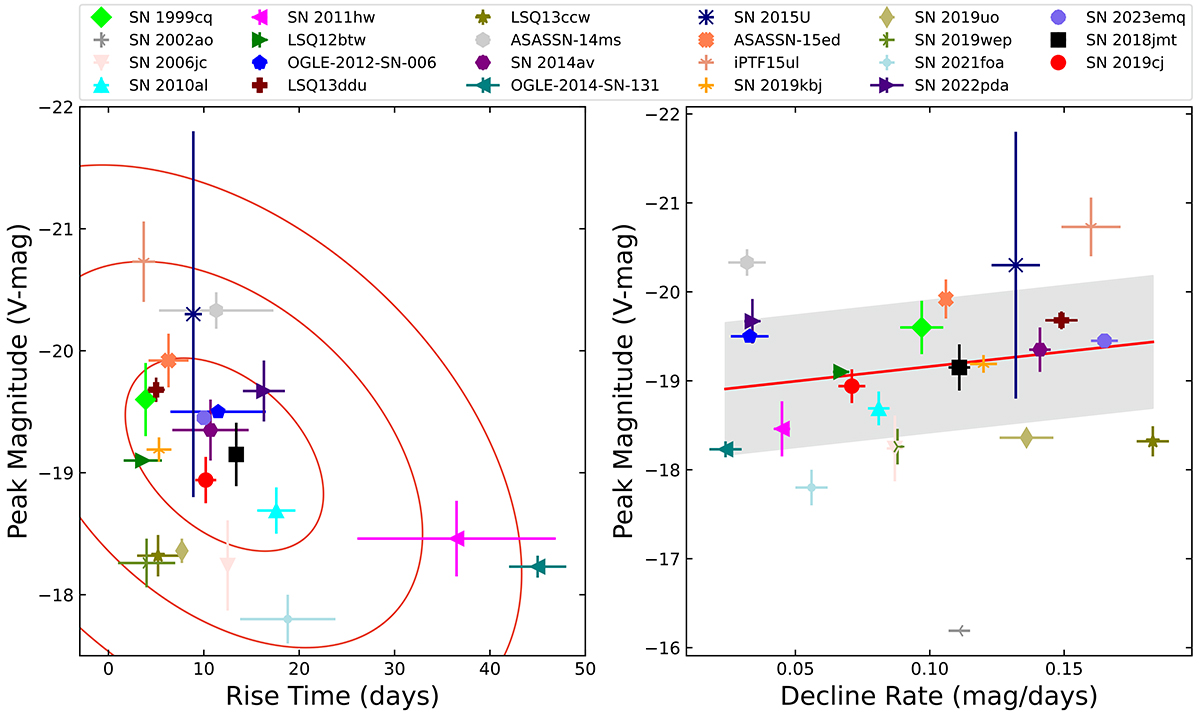
Phase-space diagrams showing peak magnitudes versus rise time (left), and peak magnitudes versus decline rates (right) for a sample of SNe Ibn, including SNe 2018jmt and 2019cj. In the left panel, three red ellipses represent the 1σ, 2σ, and 3σ confidence intervals, indicating regions where approximately 68.27%, 95.45%, and 99.73% of the points are expected to lie, respectively. These ellipses are centered at the mean values of the points and are oriented according to the principal components of the covariance matrix. In the right panel, linear fitting was applied to the observed data, and the 95% confidence interval was calculated using a standard deviation multiplier of 1.96 to determine the shaded region. Data for comparison objects are taken from Matheson et al. (2000), Pastorello et al. (2007, 2008b), Mattila et al. (2008), Pastorello et al. (2008a), Sanders et al. (2013), Morokuma et al. (2014), Gorbikov et al. (2014), Pastorello et al. (2015d,e,b,a,c, 2016), Karamehmetoglu et al. (2017), Hosseinzadeh et al. (2017), Vallely et al. (2018), Wang & Li (2020), Clark et al. (2020), Gangopadhyay et al. (2020), Prentice et al. (2020), Karamehmetoglu et al. (2021), Kool et al. (2021), Gangopadhyay et al. (2022), Reguitti et al. (2022), Pursiainen et al. (2023), Ben-Ami et al. (2023), Wang et al. (2024a), Cai et al. (in prep.).
Current usage metrics show cumulative count of Article Views (full-text article views including HTML views, PDF and ePub downloads, according to the available data) and Abstracts Views on Vision4Press platform.
Data correspond to usage on the plateform after 2015. The current usage metrics is available 48-96 hours after online publication and is updated daily on week days.
Initial download of the metrics may take a while.