Fig. 7.
Download original image
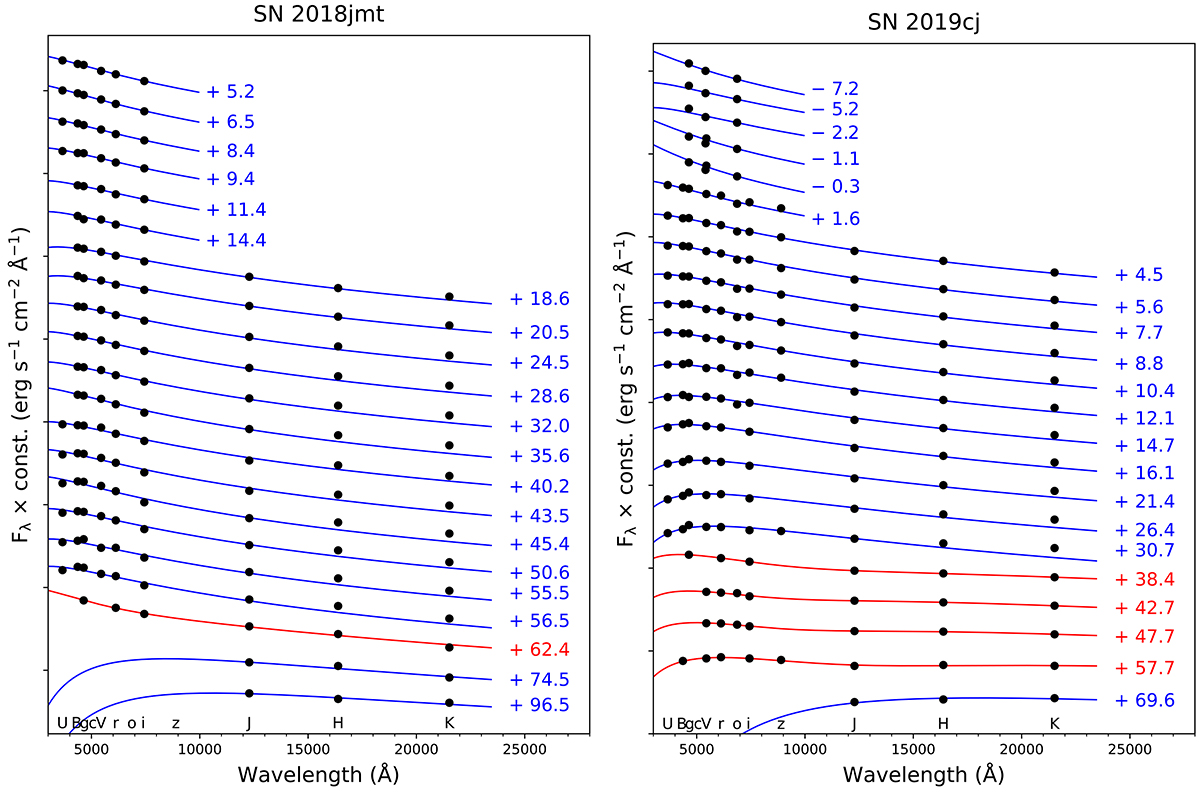
Spectral energy distribution evolution of SNe 2018jmt (left panel) and 2019cj (right panel). The lines represent the best-fit blackbody functions, which are overplotted on each SED. Blue lines are the best fits of the single blackbody, while red lines are the best fits of the two-component blackbodies. Epochs reported to the right of each SED are relative to their maximum light. SEDs have been shifted vertically by an arbitrary constant for clarity.
Current usage metrics show cumulative count of Article Views (full-text article views including HTML views, PDF and ePub downloads, according to the available data) and Abstracts Views on Vision4Press platform.
Data correspond to usage on the plateform after 2015. The current usage metrics is available 48-96 hours after online publication and is updated daily on week days.
Initial download of the metrics may take a while.