Open Access
Fig. 4.
Download original image
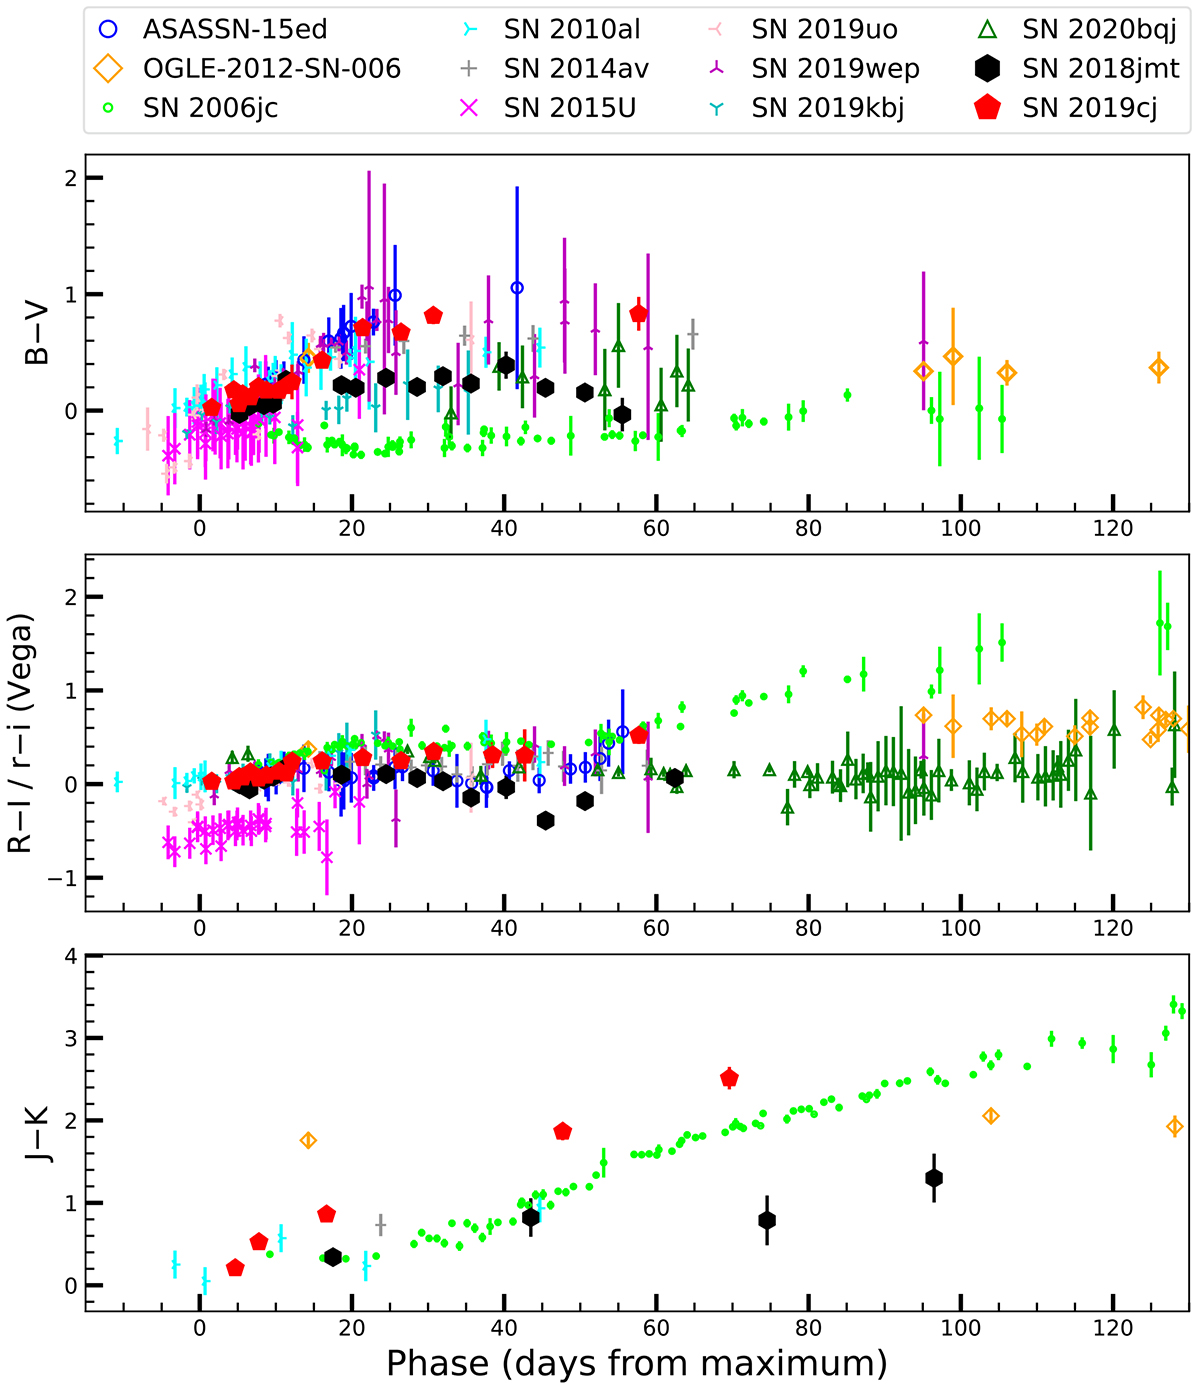
Colour evolution of SN 2018jmt and SN 2019cj compared with that of a sample of SNe Ibn. Top panel: B − V colour curves; Middle panel: R − I/r − i colour curves; Bottom panel: J − K colour curves. The colour curves have been corrected for Galactic and host galaxy extinction.
Current usage metrics show cumulative count of Article Views (full-text article views including HTML views, PDF and ePub downloads, according to the available data) and Abstracts Views on Vision4Press platform.
Data correspond to usage on the plateform after 2015. The current usage metrics is available 48-96 hours after online publication and is updated daily on week days.
Initial download of the metrics may take a while.