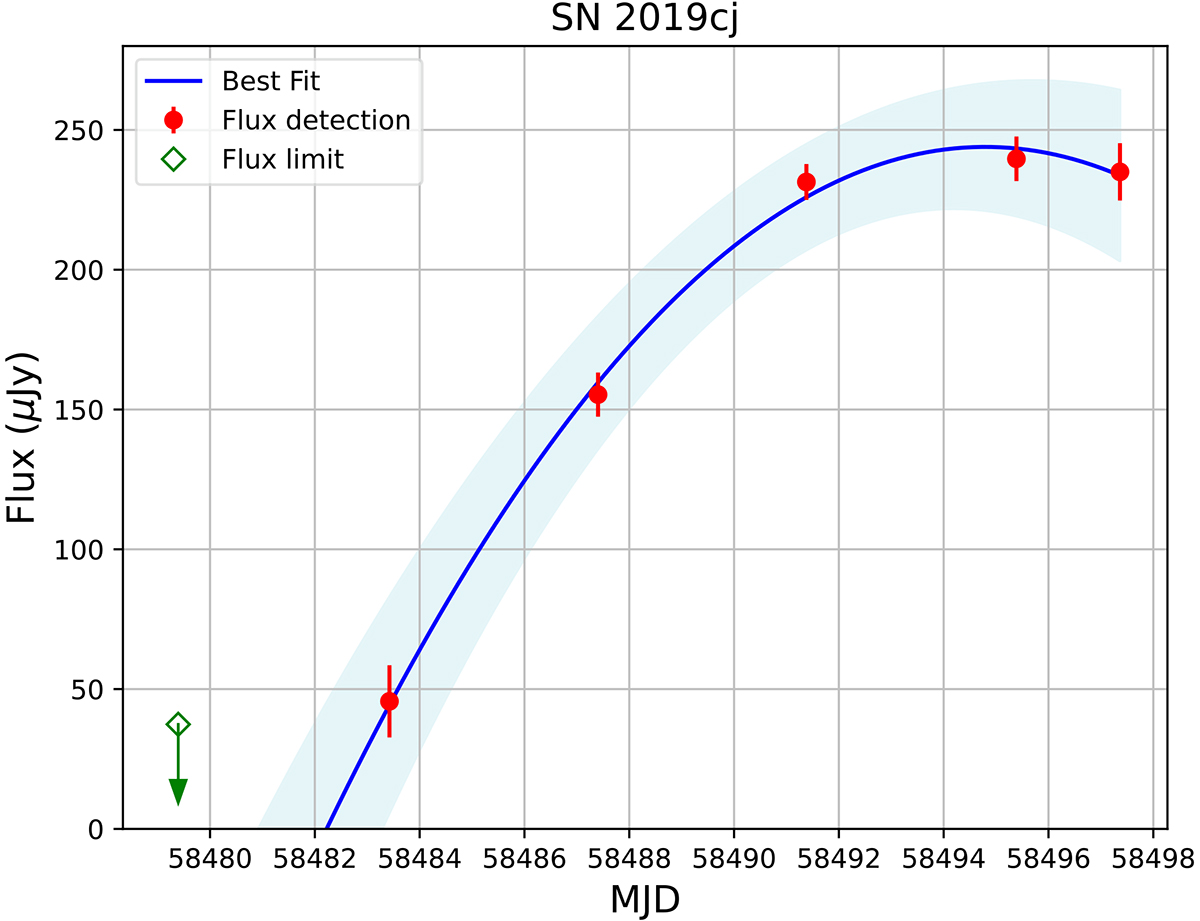
Fig. 3.
Download original image
Estimate of the explosion epoch for SN 2019cj. The ATLAS-o light curves of SN 2019cj (detections use red dot markers, limits use green diamond markers) are shown in flux space (expressed in μJy). The early light curves are fitted with a second-order polynomial, represented by a blue solid line. The blue shaded region around the fitted curve represents the 3-σ uncertainty in the fitting process.
Current usage metrics show cumulative count of Article Views (full-text article views including HTML views, PDF and ePub downloads, according to the available data) and Abstracts Views on Vision4Press platform.
Data correspond to usage on the plateform after 2015. The current usage metrics is available 48-96 hours after online publication and is updated daily on week days.
Initial download of the metrics may take a while.