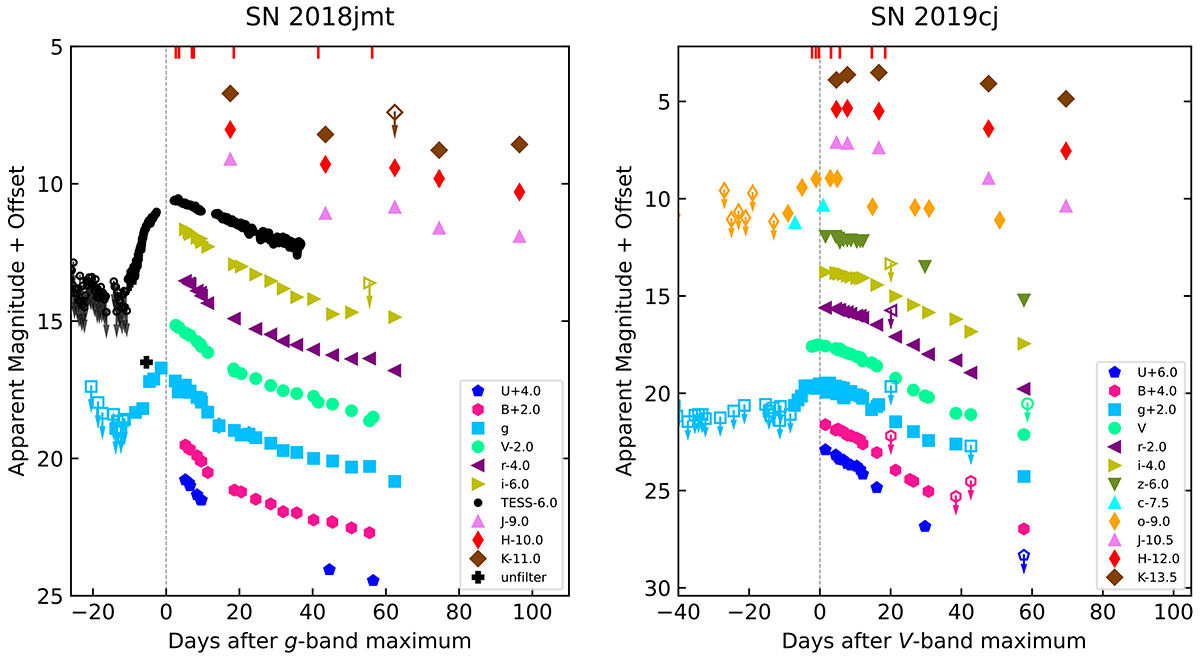
Fig. 2.
Download original image
Multi-band light curves of SN 2018jmt (left) and SN 2019cj (right). A dashed vertical line is used to visually represent the reference epoch, which corresponds to the g/V-band maximum light. The epochs of our spectra are marked with vertical solid red lines on the top. The upper limits are indicated by empty symbols with down-arrows. For clarity, the light curves are shifted by constant amounts reported in the legends. In most cases, the errors associated with the magnitudes are smaller than the plotted symbol sizes.
Current usage metrics show cumulative count of Article Views (full-text article views including HTML views, PDF and ePub downloads, according to the available data) and Abstracts Views on Vision4Press platform.
Data correspond to usage on the plateform after 2015. The current usage metrics is available 48-96 hours after online publication and is updated daily on week days.
Initial download of the metrics may take a while.