Fig. 12.
Download original image
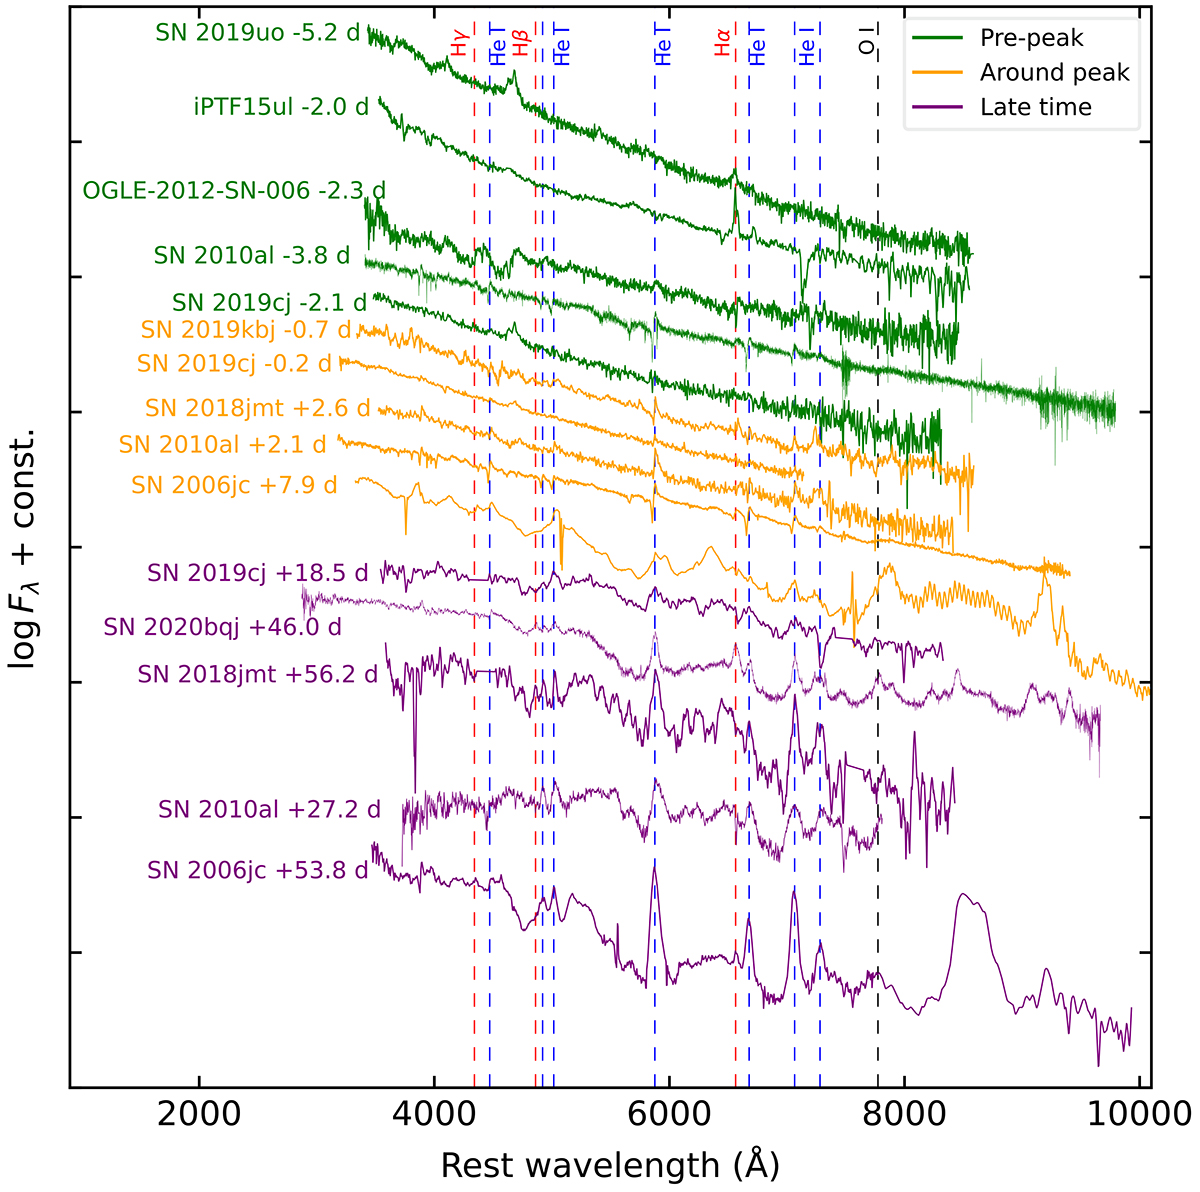
Comparison of pre-peak, around peak, and late-time spectra of SN 2018jmt and SN 2019cj with those of other SNe Ibn at similar phases. The H, He I, and O I lines are marked with dashed vertical lines. All spectra have been corrected for the respective redshift and extinction. The pre-peak spectra are shown in green, those taken near the maximum light are in orange, and the post-maximum spectra are in purple. The most significant He I lines are indicated by vertical dashed blue lines, while Balmer lines are marked with red dashed lines. The O Iλ7774 line is represented by a dashed black line.
Current usage metrics show cumulative count of Article Views (full-text article views including HTML views, PDF and ePub downloads, according to the available data) and Abstracts Views on Vision4Press platform.
Data correspond to usage on the plateform after 2015. The current usage metrics is available 48-96 hours after online publication and is updated daily on week days.
Initial download of the metrics may take a while.