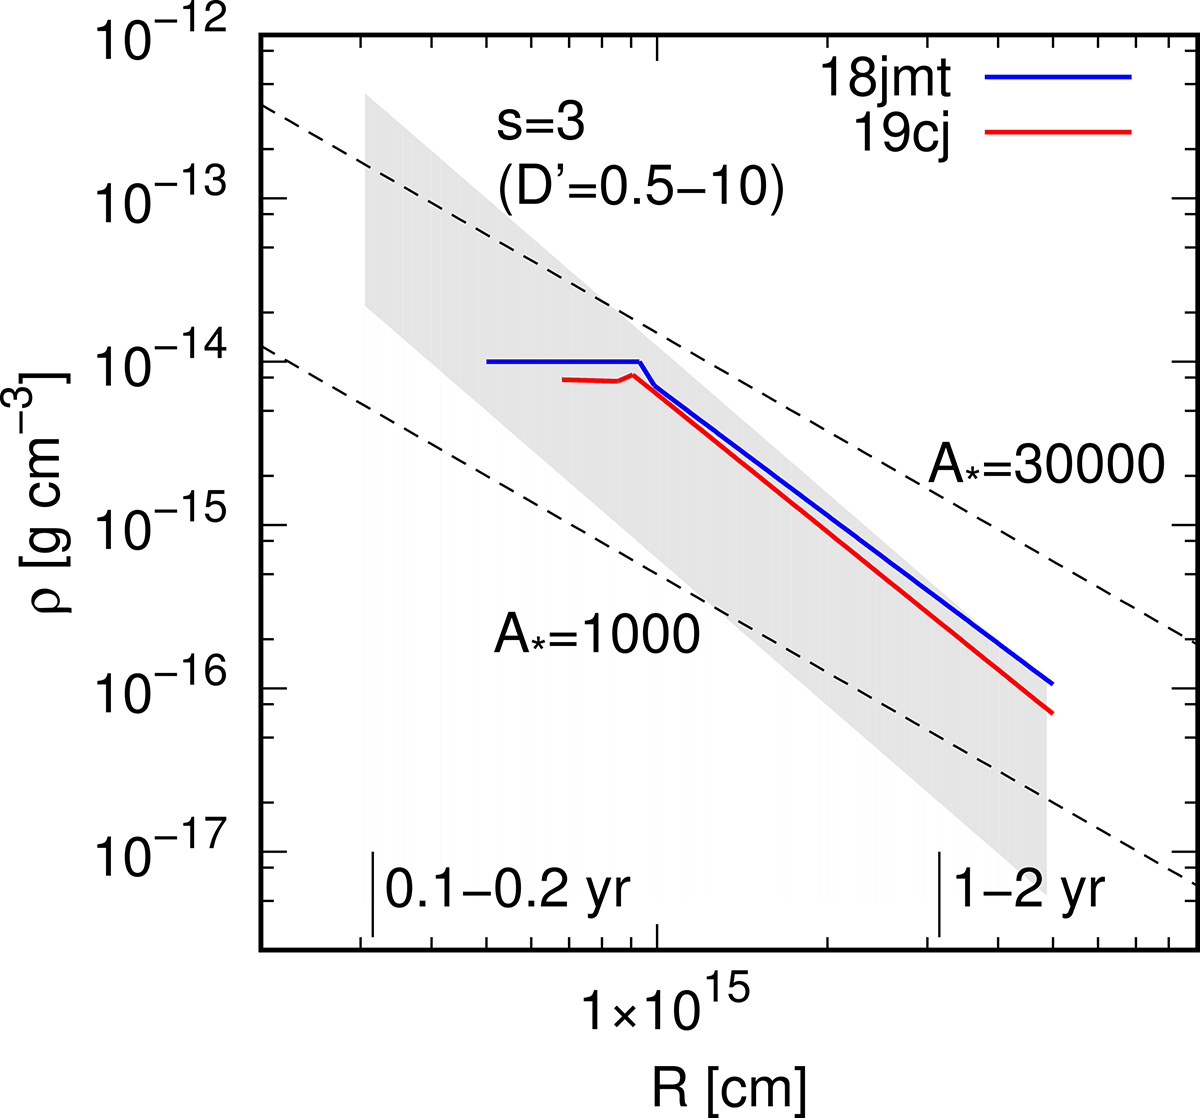
Fig. 11.

Download original image
Circumstellar medium radial-density distribution derived for SNe 2018jmt (blue) and 2019cj (red). The typical range found for a sample of SNe Ibn is shown by the grey-shaded area. For comparison, the CSM distribution by a steady-state mass loss is shown by the dashed lines for the CSM density parameter of A* = 30 000 and 1000 (corresponding to D′ = 6 and 0.2 with s = 2.0). On the bottom, the look-back time in the mass-loss history is indicated, assuming vw = 500 − 1000 km s−1.
Current usage metrics show cumulative count of Article Views (full-text article views including HTML views, PDF and ePub downloads, according to the available data) and Abstracts Views on Vision4Press platform.
Data correspond to usage on the plateform after 2015. The current usage metrics is available 48-96 hours after online publication and is updated daily on week days.
Initial download of the metrics may take a while.


