Fig. 7.
Download original image
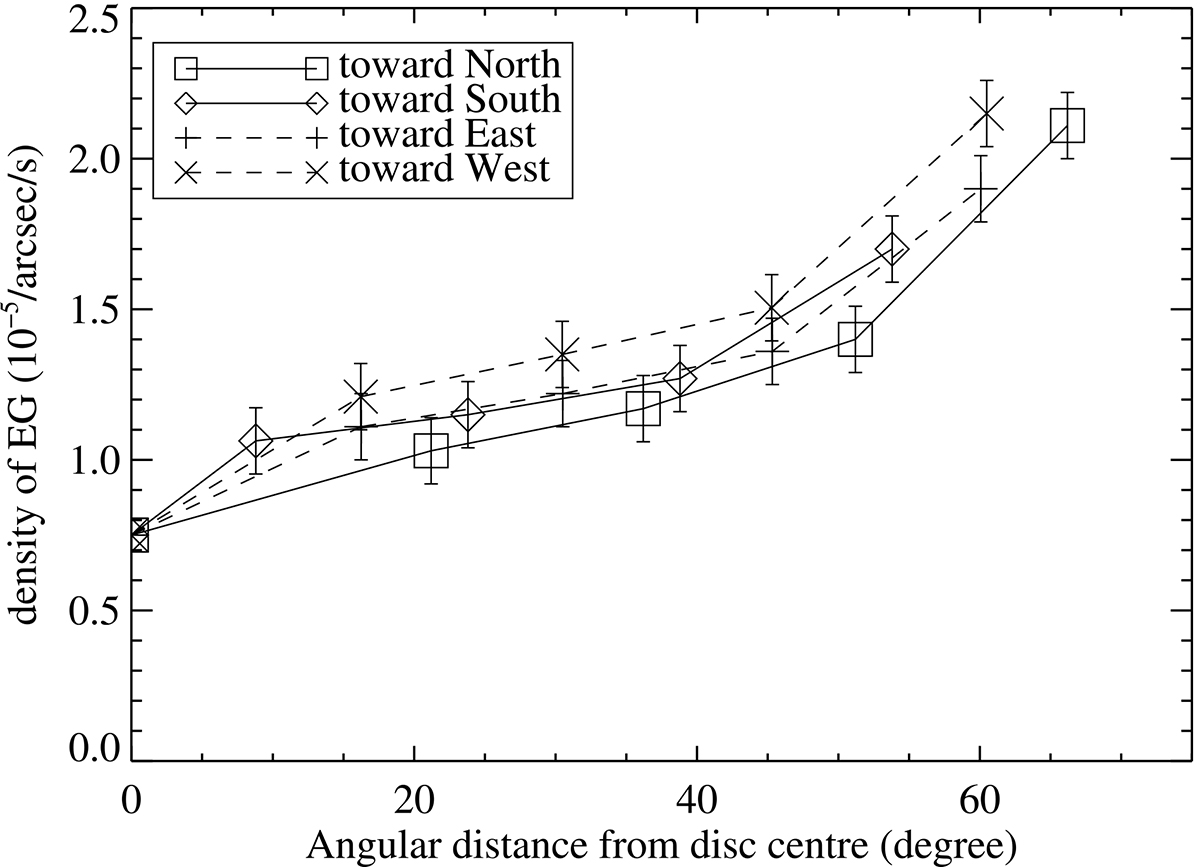
Density of exploding granules detected at different latitudes and longitudes plotted as a function of the angular distance from disc centre. Solid lines join points along the central meridian in the northern (squares) and southern hemisphere (diamonds). Dashed lines join points along the equator in the eastern (plus signs) and western (crosses) directions.
Current usage metrics show cumulative count of Article Views (full-text article views including HTML views, PDF and ePub downloads, according to the available data) and Abstracts Views on Vision4Press platform.
Data correspond to usage on the plateform after 2015. The current usage metrics is available 48-96 hours after online publication and is updated daily on week days.
Initial download of the metrics may take a while.