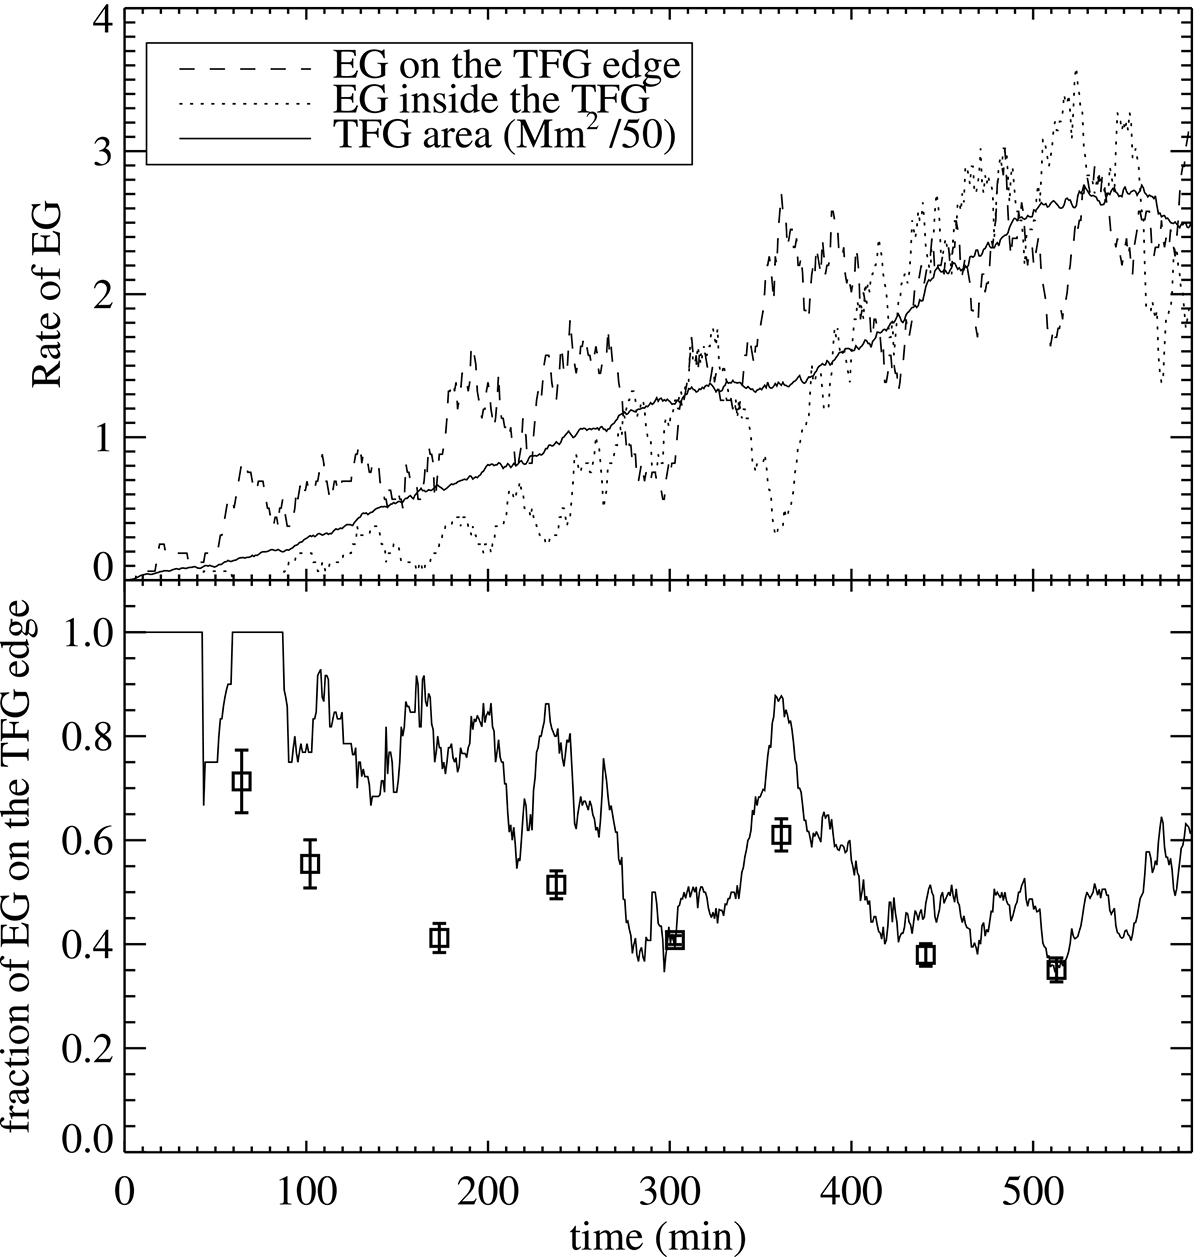
Fig. 6.
Download original image
Evolution of exploding granules in the TFG studied in this work. Top: Number of exploding granules detected per minute on the edge of the TFG (dashed line) and inside the TFG (dotted line). The curves were smoothed with a 15-min-wide boxcar. For comparison, the evolution of the TFG area is also plotted (solid line, expressed in Mm2 divided by a factor of 50). The origin of time is the birth of the TFG. Bottom: Fraction of exploding granules of the TFG appearing on the edge (solid line). Squares show the fraction of granules of the TFG lying on its edge at some time steps (64, 102, 173, 238, 303, 361, 441, and 513 min). Error bars indicate the standard deviation obtained by counting the granules in consecutive images (see text for details).
Current usage metrics show cumulative count of Article Views (full-text article views including HTML views, PDF and ePub downloads, according to the available data) and Abstracts Views on Vision4Press platform.
Data correspond to usage on the plateform after 2015. The current usage metrics is available 48-96 hours after online publication and is updated daily on week days.
Initial download of the metrics may take a while.