Fig. 3.
Download original image
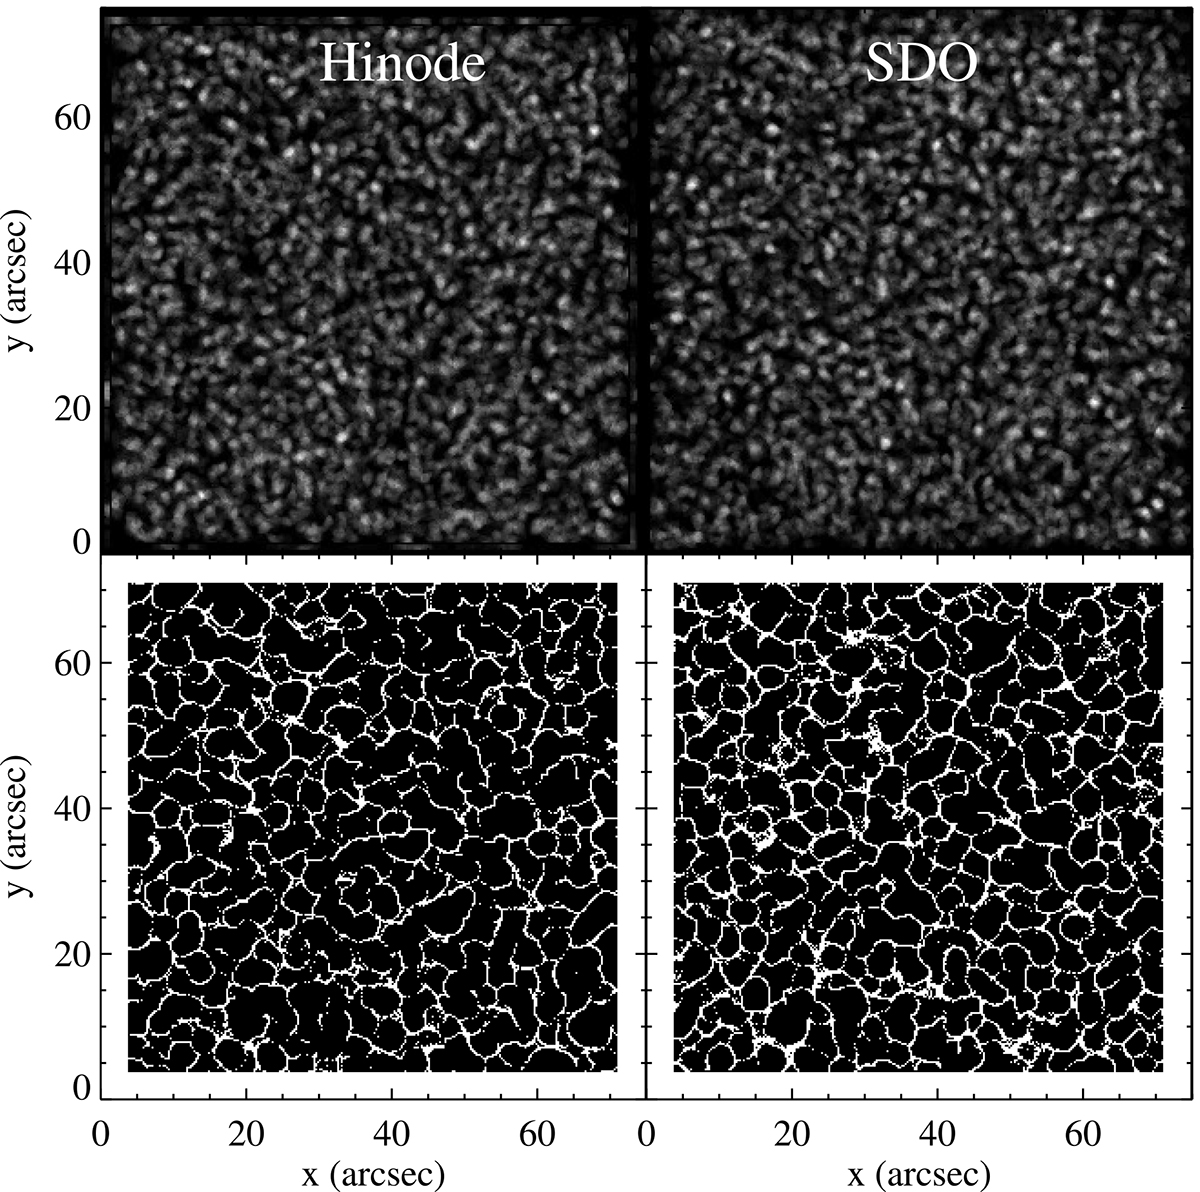
Comparison of exploding granules detected with Hinode and SDO/HMI in a simultaneous sequence. Top: Intensity maps constructing by summing up all exploding granules detected during 1h55m on Hinode(left) and SDO/HMI (right) with a pixel of 0.25″. Bottom: Location of corks diffused by these detected exploding granules using our kinematic model using Hinode(left) and SDO/HMI (right). The field of view covers 75″ × 75″ at the disc centre.
Current usage metrics show cumulative count of Article Views (full-text article views including HTML views, PDF and ePub downloads, according to the available data) and Abstracts Views on Vision4Press platform.
Data correspond to usage on the plateform after 2015. The current usage metrics is available 48-96 hours after online publication and is updated daily on week days.
Initial download of the metrics may take a while.