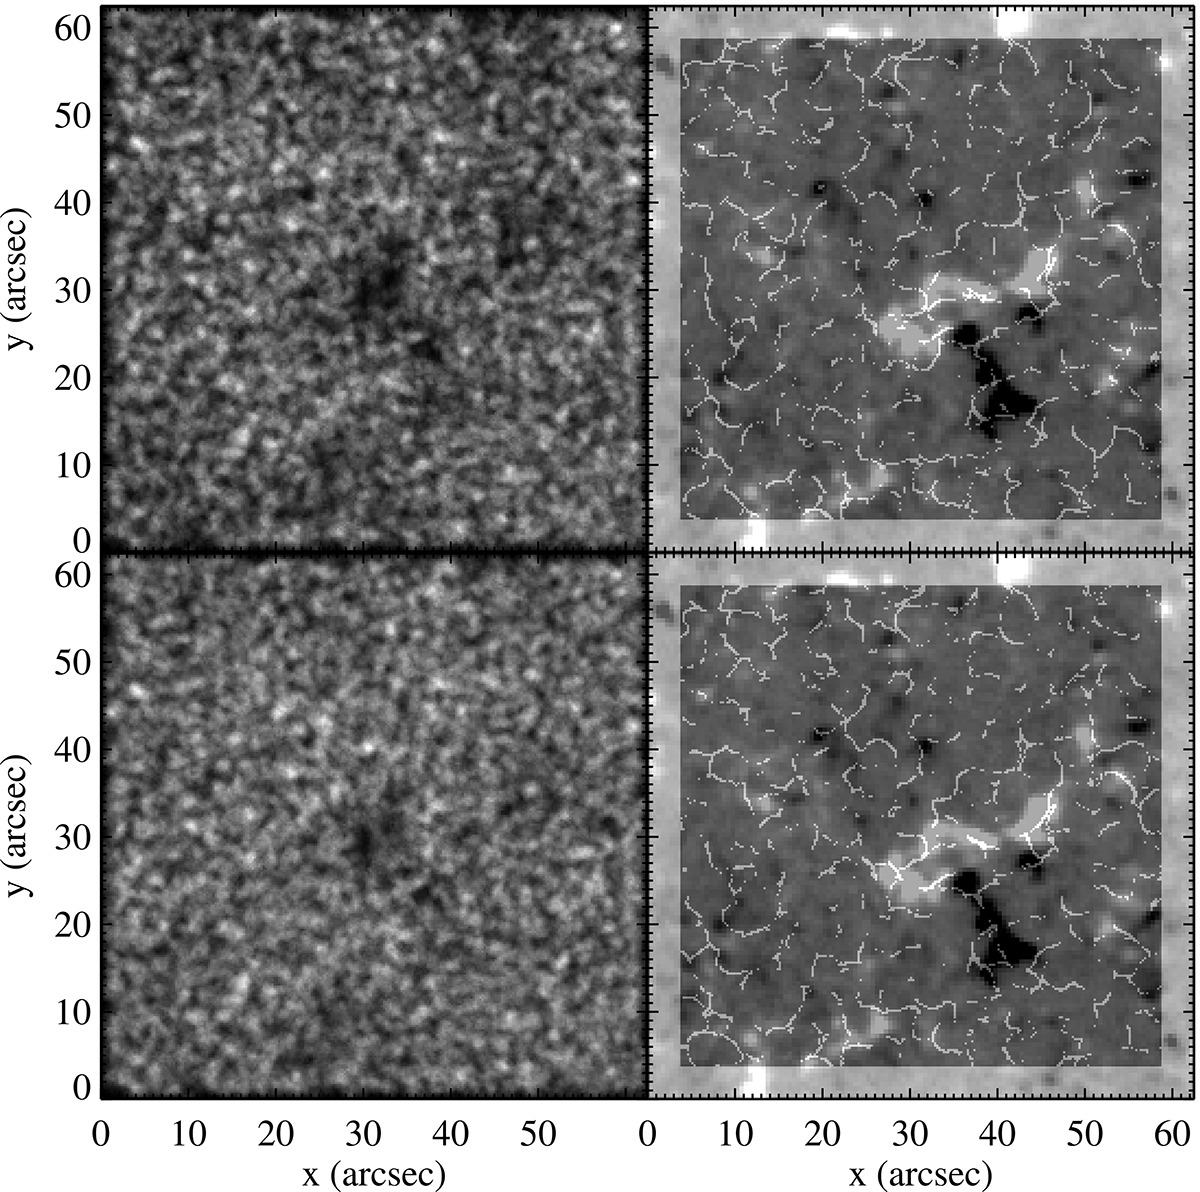
Fig. 2.
Download original image
Detected exploding granules during 24 h and their impact on corks. Left column: Intensity maps constructing by summing up all exploding granules detected during 24 h: bright and dark zones indicate high and low rates of exploding granules, respectively. Right column: Location of corks diffused by these detected exploding granules using our kinematic model, superimposed over maps of the longitudinal magnetic field observed by SDO/HMI at the end of the 24-h run. The exploding granule detection was performed with a criterion for the vertical velocity (top row) and without (bottom row). The field of view is located at the disc centre of size 62.5″ × 62.5″.
Current usage metrics show cumulative count of Article Views (full-text article views including HTML views, PDF and ePub downloads, according to the available data) and Abstracts Views on Vision4Press platform.
Data correspond to usage on the plateform after 2015. The current usage metrics is available 48-96 hours after online publication and is updated daily on week days.
Initial download of the metrics may take a while.