Fig. 9.
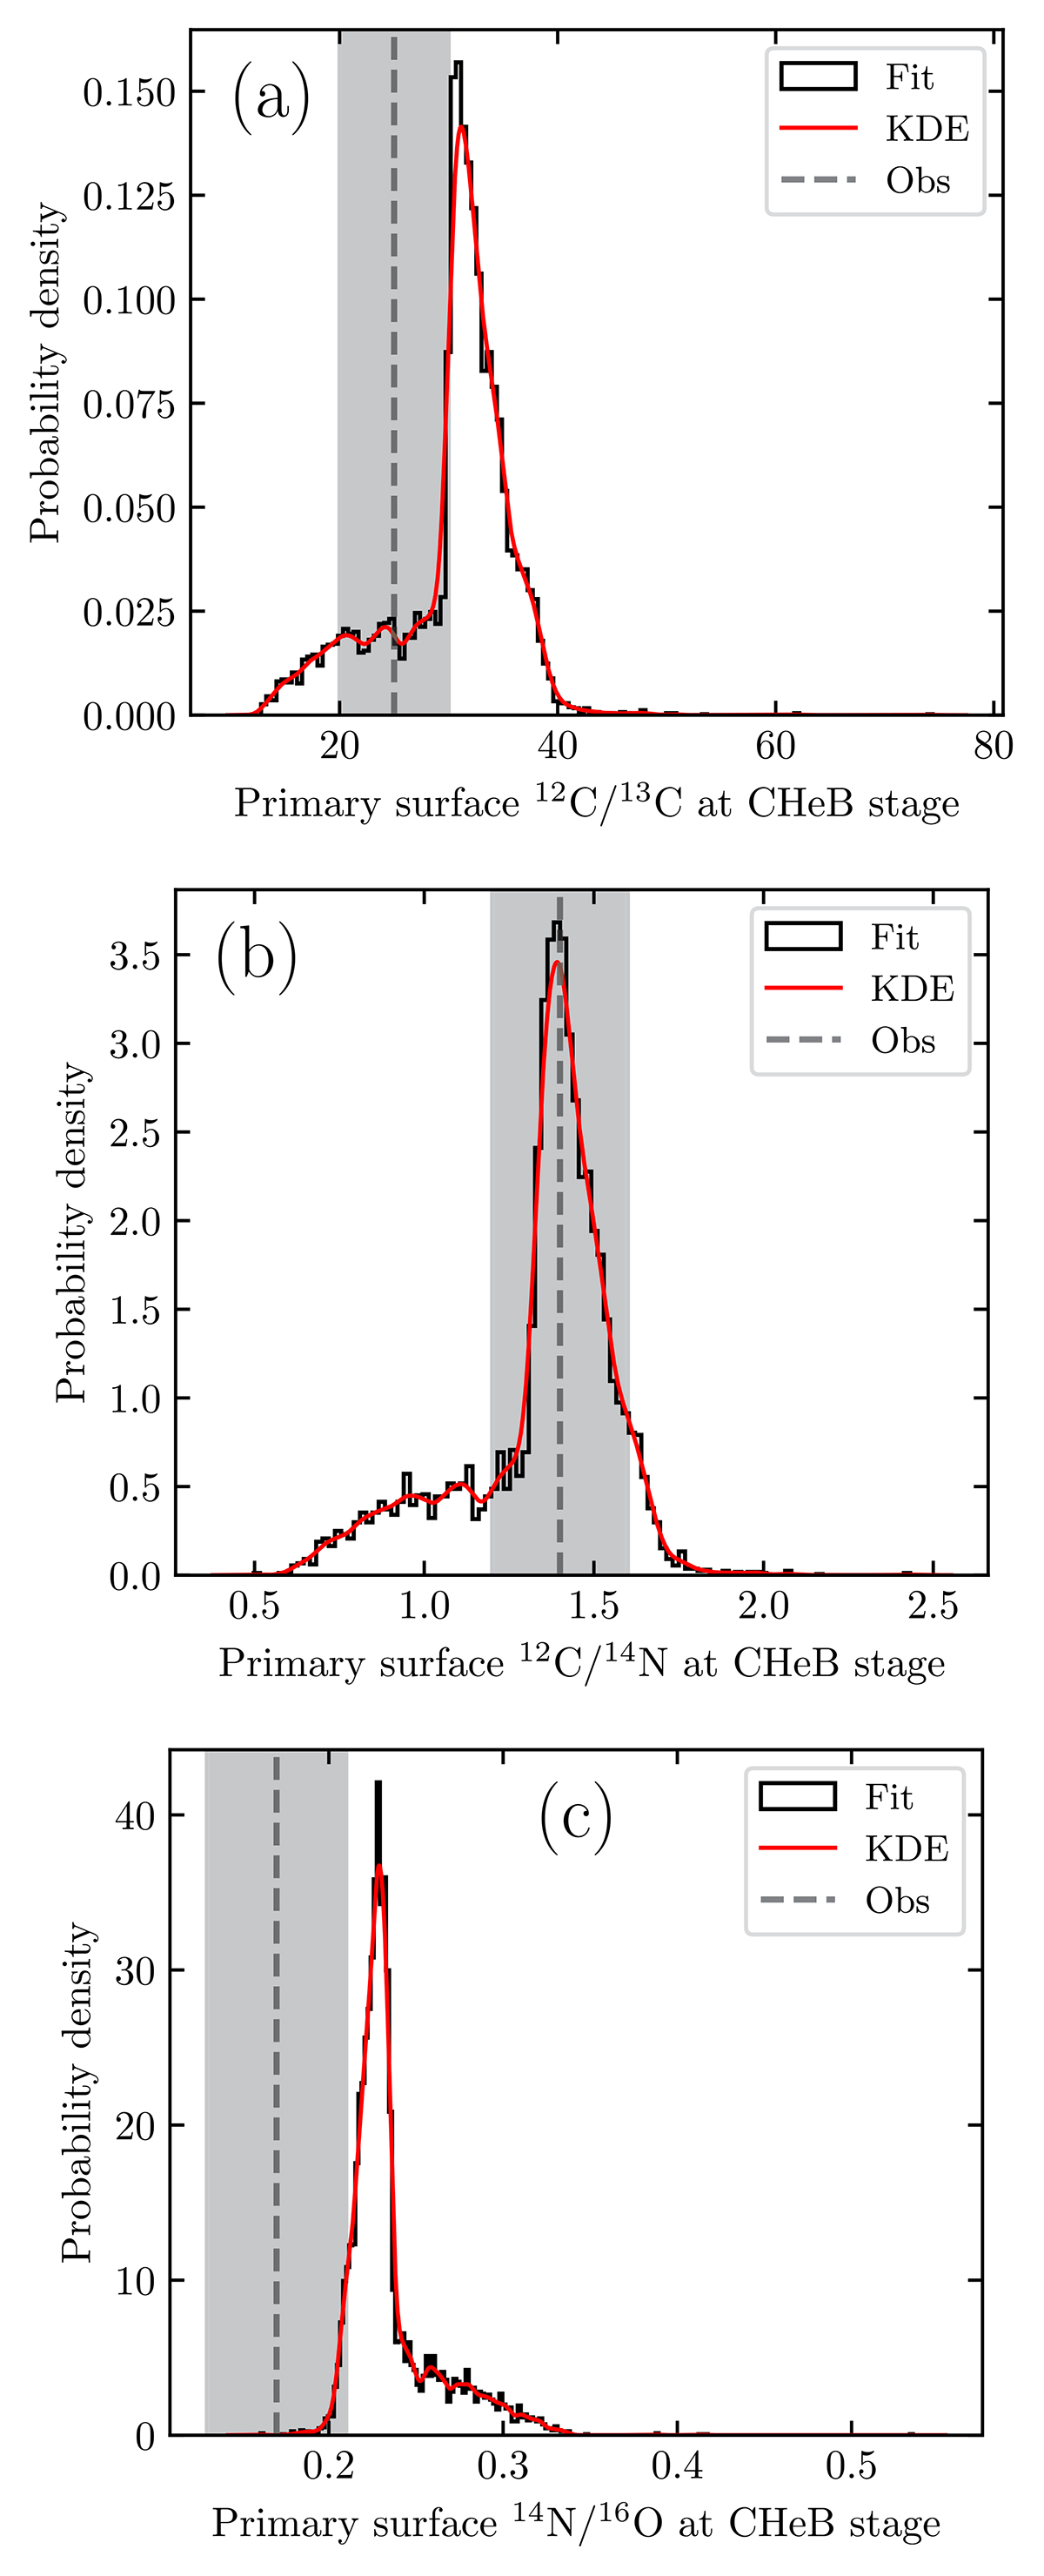
Download original image
Primary star 12C/13C, 12C/14N and 14N/16O density distributions at the CHeB stage for the subsample described in Sect. 4.2. In particular, we show the histogram (black lines) and the kernel density estimation with a Gaussian kernel (red lines). The dashed line and grey area represent the observed values of KIC4937011 and their 1σ errors (see also Table 1). As explained in Appendix A, we take the age that gives the highest likelihood as the reference time for the CHeB of each MC simulation.
Current usage metrics show cumulative count of Article Views (full-text article views including HTML views, PDF and ePub downloads, according to the available data) and Abstracts Views on Vision4Press platform.
Data correspond to usage on the plateform after 2015. The current usage metrics is available 48-96 hours after online publication and is updated daily on week days.
Initial download of the metrics may take a while.