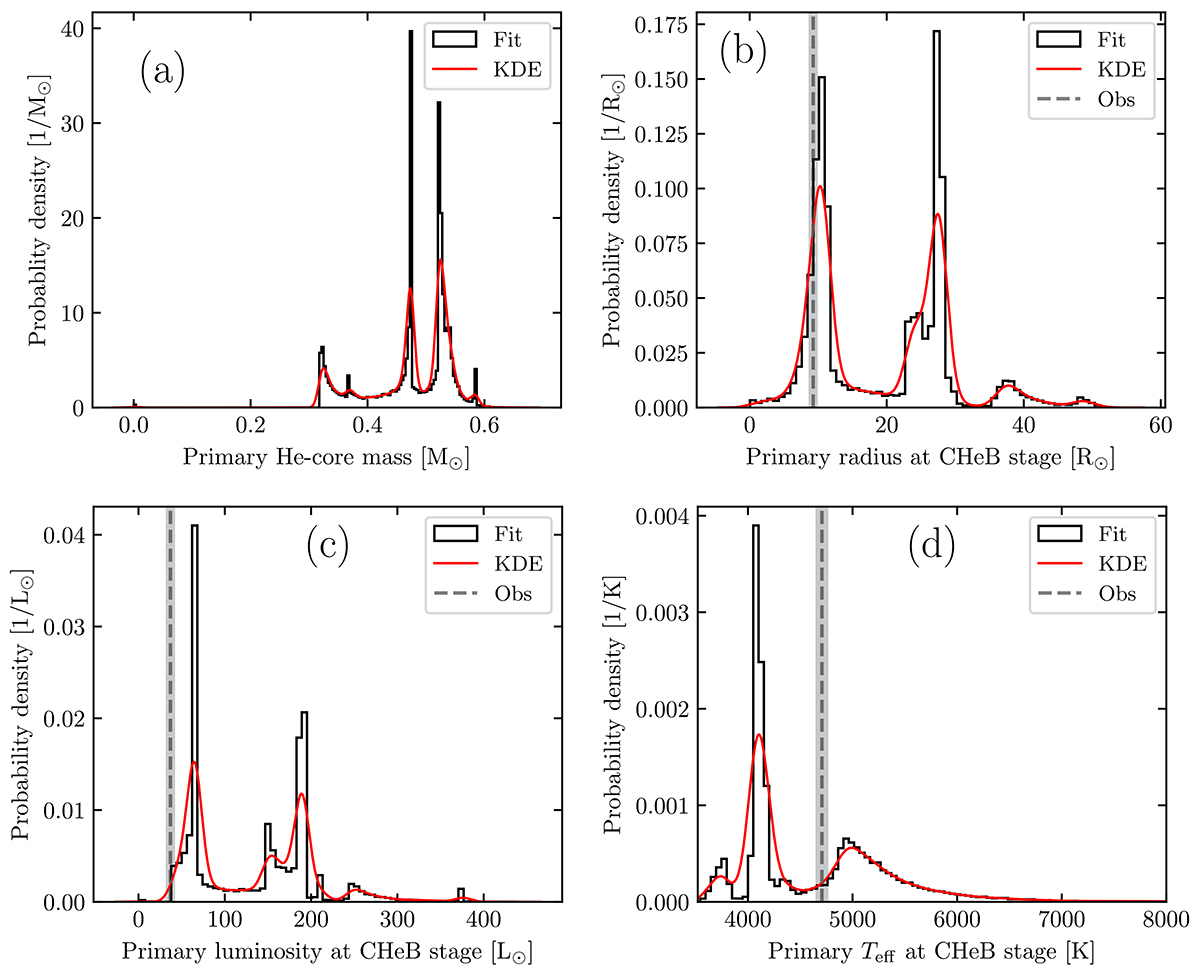
Fig. 4.
Download original image
Helium-core mass (panel a), radius (panel b), luminosity (panel c), and effective temperature (panel d) posterior density distributions of the primary star during the CHeB stage for the full sample described in Sect. 3.2. We show the histogram (black lines) and the kernel density estimate with a Gaussian kernel (KDE, red lines). The dashed line and the grey area represent the KIC4937011 observations and their 1σ errors (Table 1). Effective temperatures above 8000 K are omitted from the figure for clarity. As explained in Appendix A, we take the age that gives the highest likelihood as the reference time for the CHeB of each MC simulation.
Current usage metrics show cumulative count of Article Views (full-text article views including HTML views, PDF and ePub downloads, according to the available data) and Abstracts Views on Vision4Press platform.
Data correspond to usage on the plateform after 2015. The current usage metrics is available 48-96 hours after online publication and is updated daily on week days.
Initial download of the metrics may take a while.