Fig. 2.
Download original image
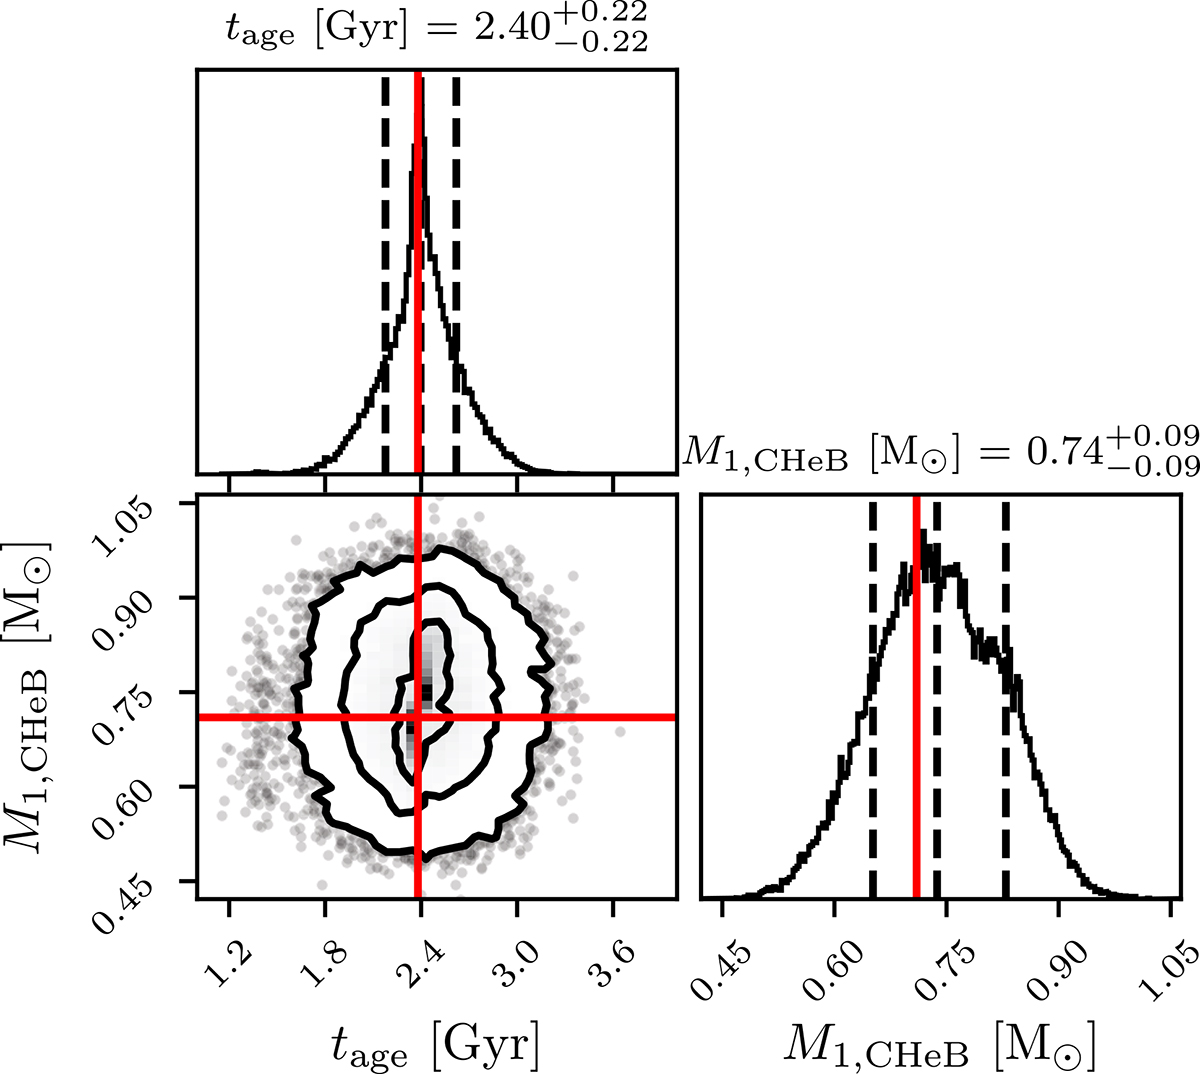
Corner plot showing the age and primary mass density distributions at the CHeB stage for the full sample as described in Sect. 3.2. The contours refer to the 1, 2, and 3σ credible regions. The observed values for KIC4937011 are plotted in red (see also Table 1). We see that our modelling correctly fits, within errors, the observed current age and mass of KIC4937011. As explained in Appendix A, we take as the reference time for the CHeB of each MC simulation the age that gives the highest likelihood.
Current usage metrics show cumulative count of Article Views (full-text article views including HTML views, PDF and ePub downloads, according to the available data) and Abstracts Views on Vision4Press platform.
Data correspond to usage on the plateform after 2015. The current usage metrics is available 48-96 hours after online publication and is updated daily on week days.
Initial download of the metrics may take a while.