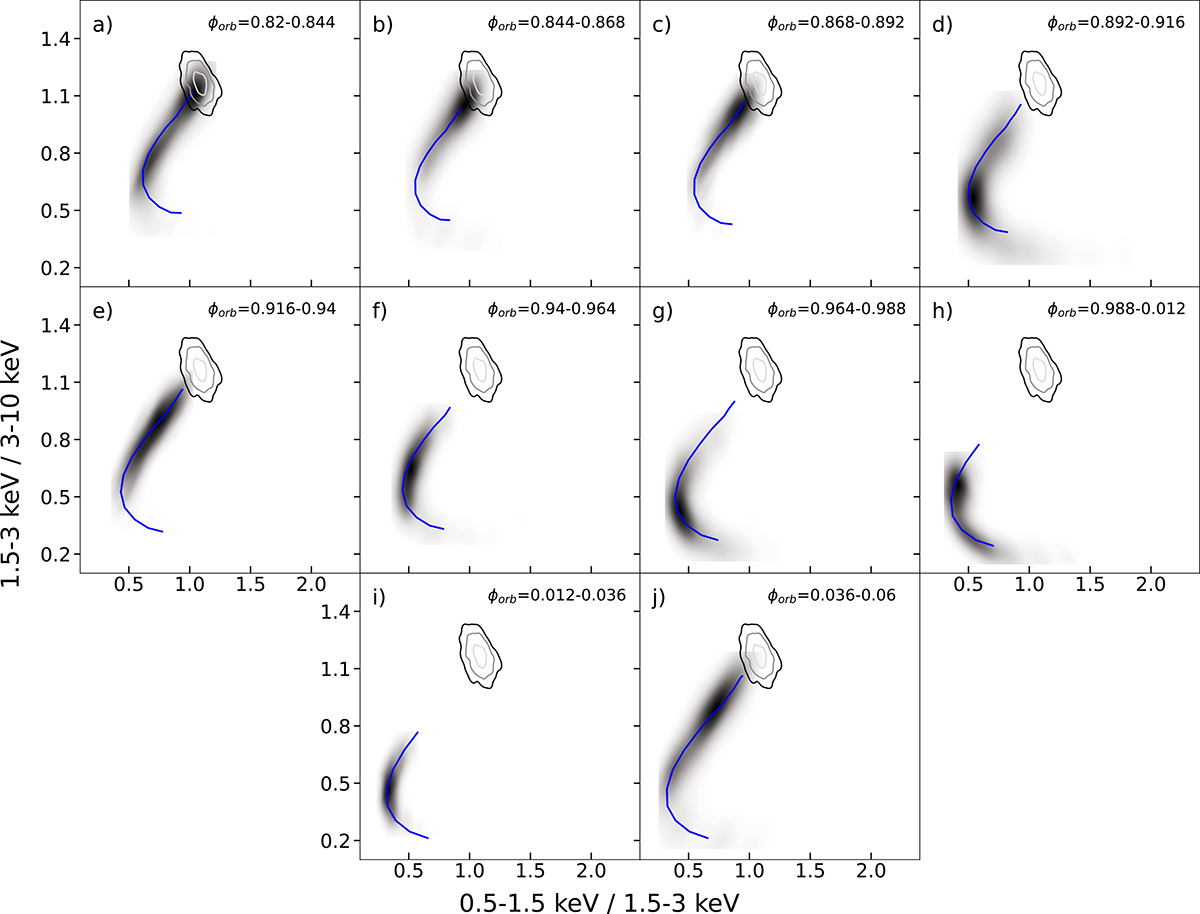
Fig. 8.
Download original image
Probability distribution maps of each time-resolved colour-colour diagram obtained using the KDE method. In blue, the best-fit simulated track. The grey-shaded closed curves represent the probability distribution map for orbital phases ϕorb = 0.43 − 0.46 at the 99.7% (in black), 95% (in grey), and 68% (in light grey) confidence levels.
Current usage metrics show cumulative count of Article Views (full-text article views including HTML views, PDF and ePub downloads, according to the available data) and Abstracts Views on Vision4Press platform.
Data correspond to usage on the plateform after 2015. The current usage metrics is available 48-96 hours after online publication and is updated daily on week days.
Initial download of the metrics may take a while.