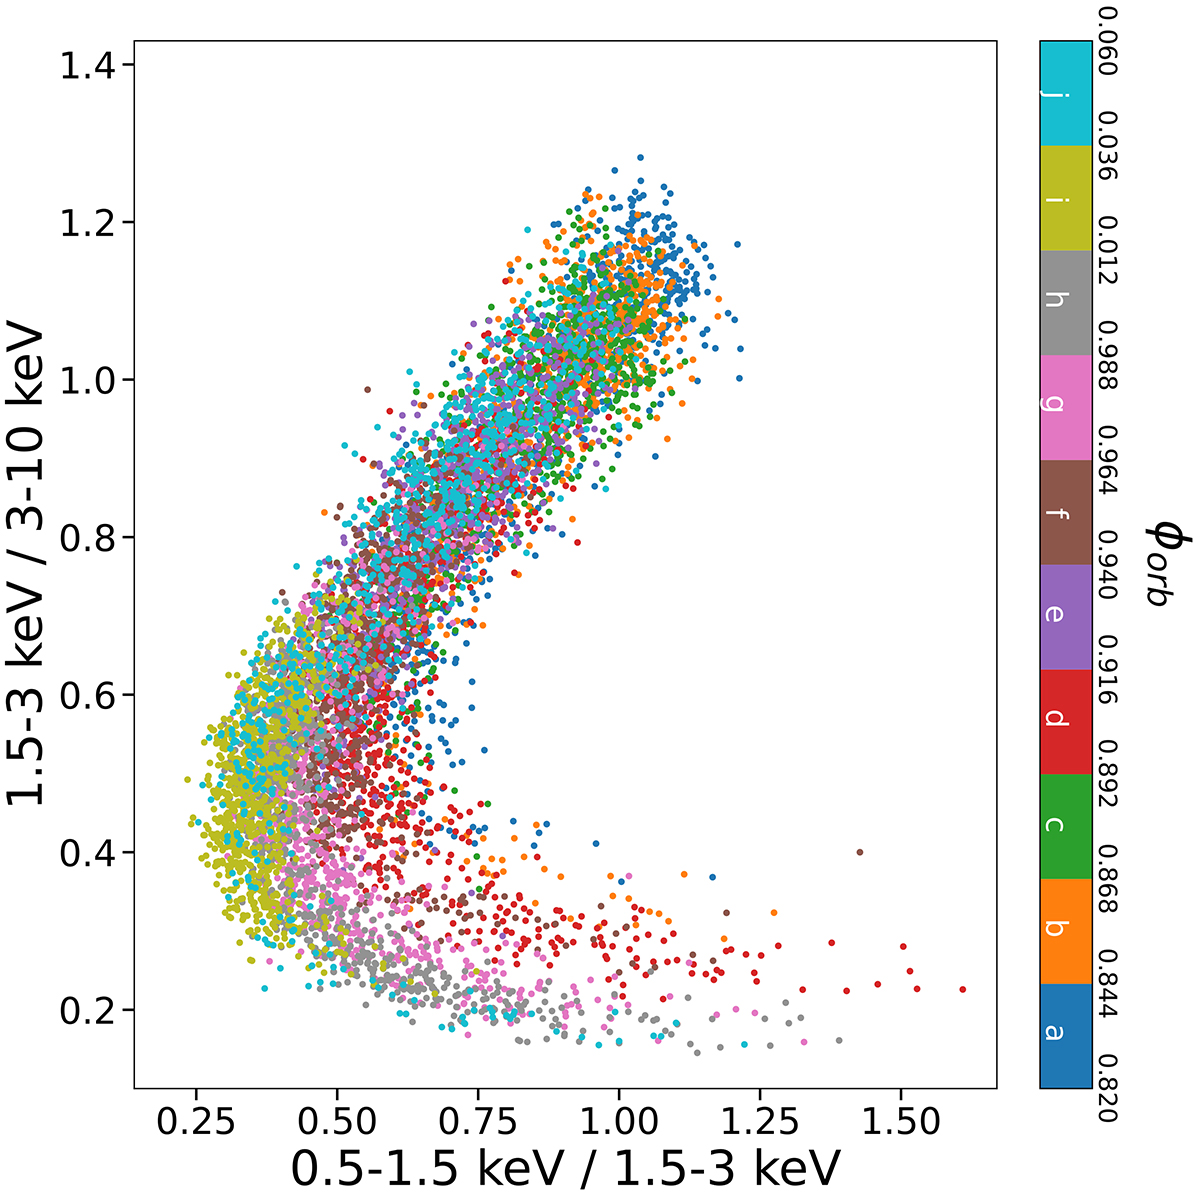
Fig. 7.
Download original image
Time-resolved colour-colour diagrams of observation 201, extracted from segments with a duration of 11 ks (corresponding to ∼0.024 in orbital phase) and time resolution of 10 s. The resulting ten colour-colour diagrams are overplotted using different colours that correspond to different phase intervals, according to the colour map reported on the right.
Current usage metrics show cumulative count of Article Views (full-text article views including HTML views, PDF and ePub downloads, according to the available data) and Abstracts Views on Vision4Press platform.
Data correspond to usage on the plateform after 2015. The current usage metrics is available 48-96 hours after online publication and is updated daily on week days.
Initial download of the metrics may take a while.