Fig. 5.
Download original image
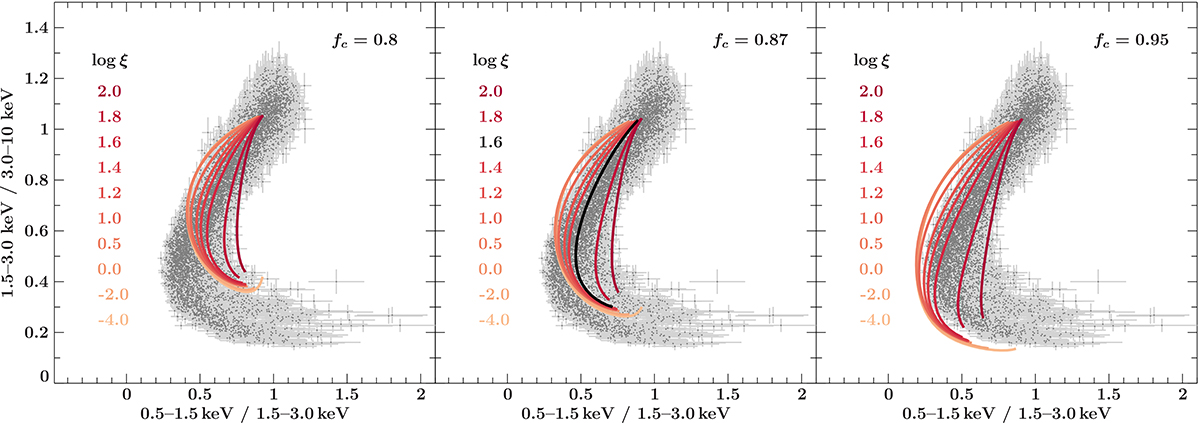
Simulated tracks for a homogeneously ionised absorber (with log ξ values ranging between −4 and 2) compared to the colour-colour diagram of observation 201. The different panels show the simulated tracks computed for different values of fc: 0.8 (left), 0.87 (middle), 0.95 (right). The black curve in the middle panel represents the one that best describes the data.
Current usage metrics show cumulative count of Article Views (full-text article views including HTML views, PDF and ePub downloads, according to the available data) and Abstracts Views on Vision4Press platform.
Data correspond to usage on the plateform after 2015. The current usage metrics is available 48-96 hours after online publication and is updated daily on week days.
Initial download of the metrics may take a while.