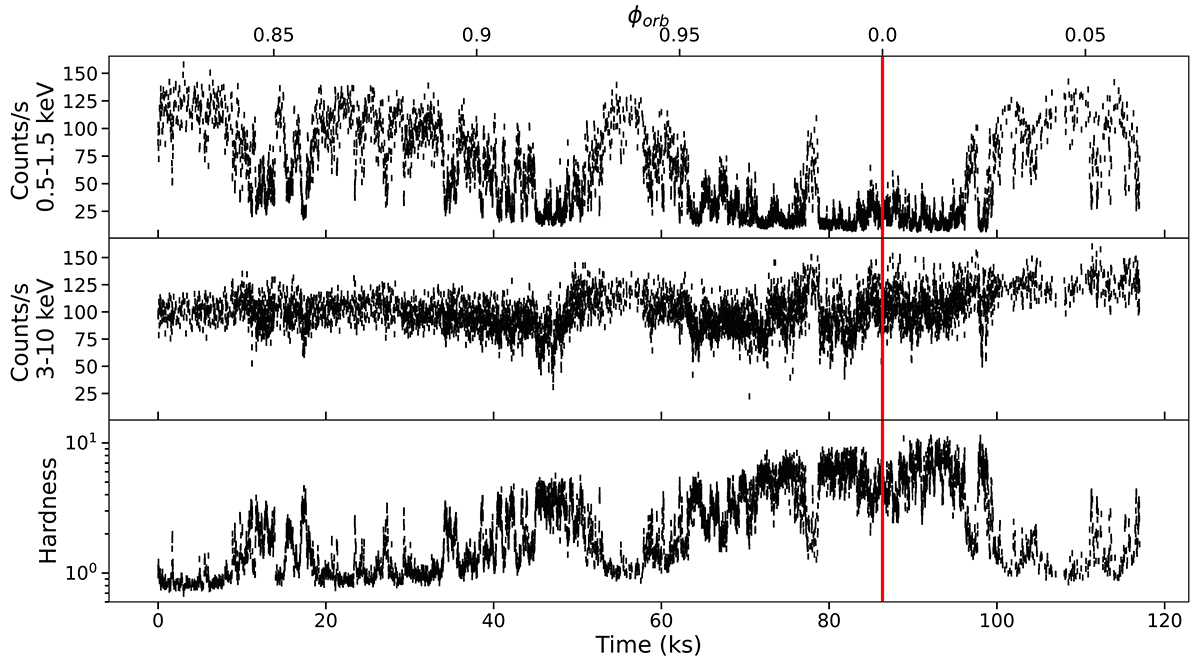
Fig. 2.
Download original image
XMM–Newton EPIC-pn light curves of the observation 201 of Cyg X-1 with time bins of 10 s. The upper and the middle panels show, respectively, the 0.5 − 1.5 keV and the 3 − 10 keV light curves. The bottom panel reports the hardness, i.e. the ratio between count rates in the 3 − 10 keV and 0.5 − 1.5 keV energy bands. The vertical red line indicates the passage at superior conjunction (i.e. ϕorb = 0).
Current usage metrics show cumulative count of Article Views (full-text article views including HTML views, PDF and ePub downloads, according to the available data) and Abstracts Views on Vision4Press platform.
Data correspond to usage on the plateform after 2015. The current usage metrics is available 48-96 hours after online publication and is updated daily on week days.
Initial download of the metrics may take a while.