Fig. B.1.
Download original image
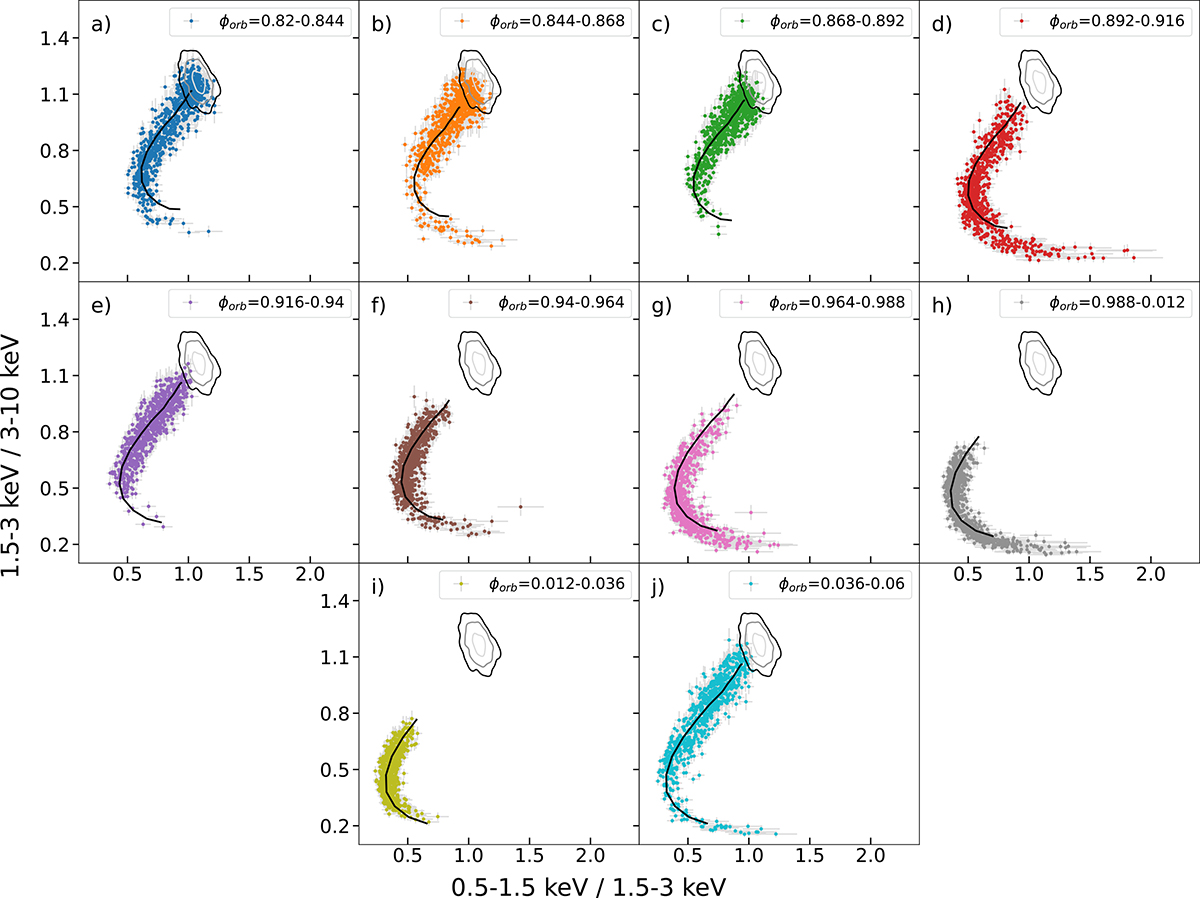
Time-resolved colour-colour diagrams of observation 201. Overplotted (black tracks) are the best-fit models obtained assuming ![]() . The contour plots represent the 99.7% (in black), 95% (in grey) and 68% (in light grey) confidence levels of the data distribution during the least absorbed stages of the orbit (ϕorb = 0.43 − 0.46, see Appendix C).
. The contour plots represent the 99.7% (in black), 95% (in grey) and 68% (in light grey) confidence levels of the data distribution during the least absorbed stages of the orbit (ϕorb = 0.43 − 0.46, see Appendix C).
Current usage metrics show cumulative count of Article Views (full-text article views including HTML views, PDF and ePub downloads, according to the available data) and Abstracts Views on Vision4Press platform.
Data correspond to usage on the plateform after 2015. The current usage metrics is available 48-96 hours after online publication and is updated daily on week days.
Initial download of the metrics may take a while.