Fig. A.2.
Download original image
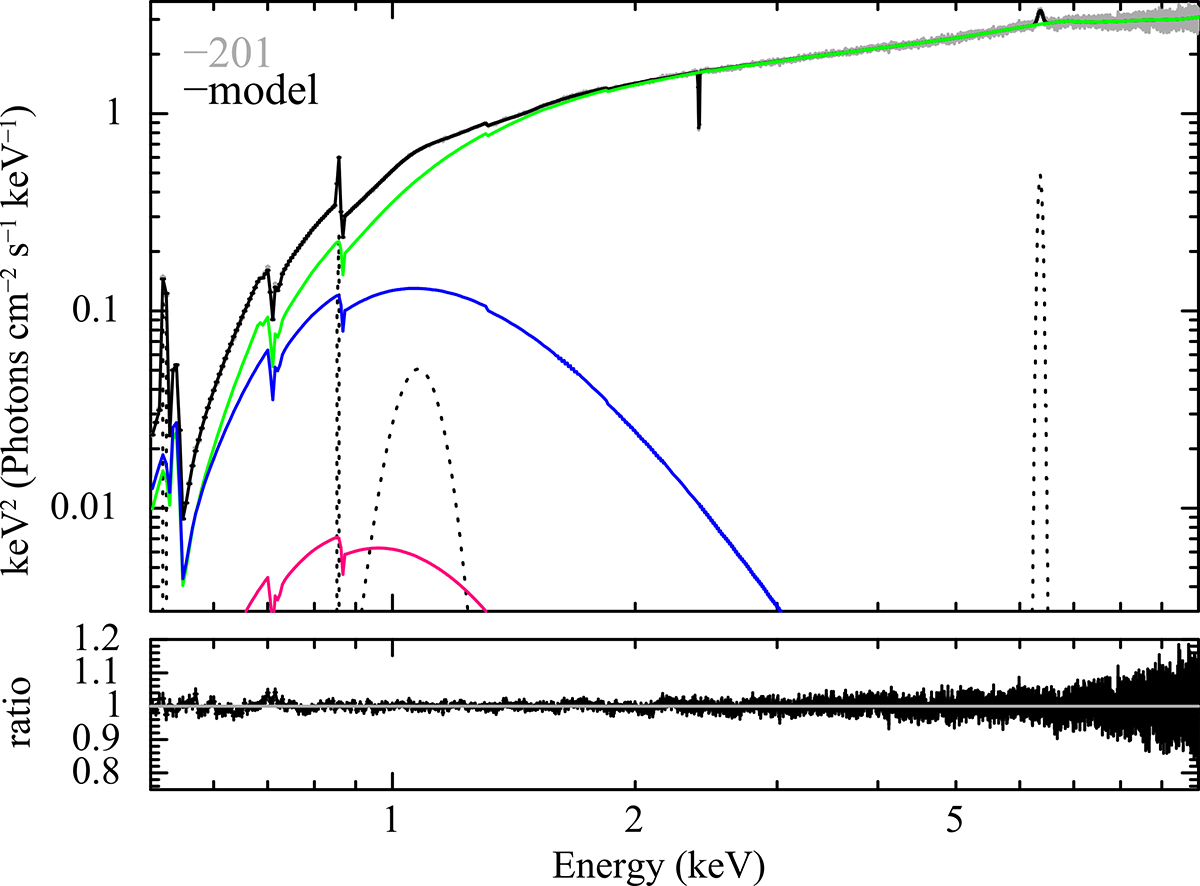
The best-fit model of the NWA time-averaged spectrum of observation 201. The complex best-fit model is overplotted in black, while the single components are shown in different colours: in magenta the disc blackbody, in blue the soft excess, in green the hard Comptonisation component and its relative reflection and in dotted grey the additional gaussians. Ratios of the data to the best-fitting model are shown in the bottom panel.
Current usage metrics show cumulative count of Article Views (full-text article views including HTML views, PDF and ePub downloads, according to the available data) and Abstracts Views on Vision4Press platform.
Data correspond to usage on the plateform after 2015. The current usage metrics is available 48-96 hours after online publication and is updated daily on week days.
Initial download of the metrics may take a while.