Open Access
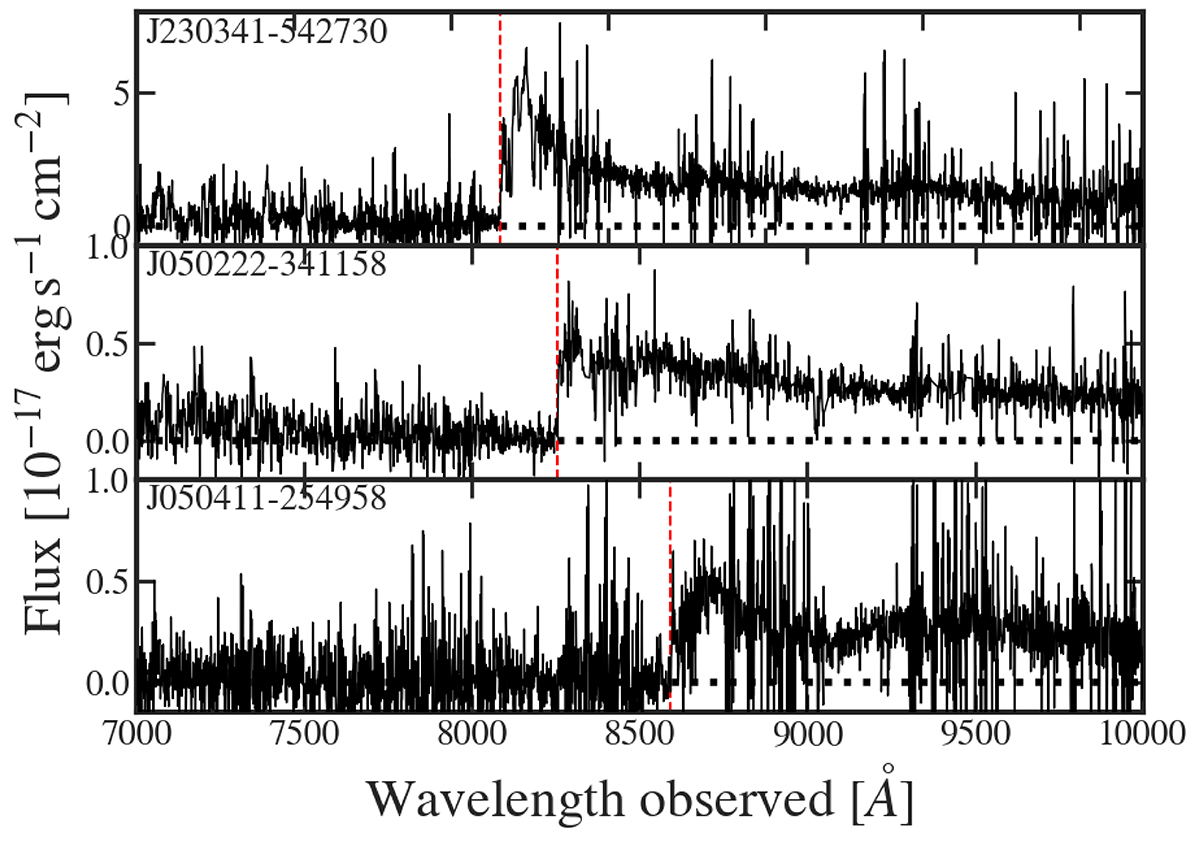
Fig. 7.
Download original image
Spectra of three newly discovered quasars selected during the calibration of the pipeline. These objects are not robustly detected in eROSITA. The red dashed line indicates the location of the Lyman α break.
Current usage metrics show cumulative count of Article Views (full-text article views including HTML views, PDF and ePub downloads, according to the available data) and Abstracts Views on Vision4Press platform.
Data correspond to usage on the plateform after 2015. The current usage metrics is available 48-96 hours after online publication and is updated daily on week days.
Initial download of the metrics may take a while.