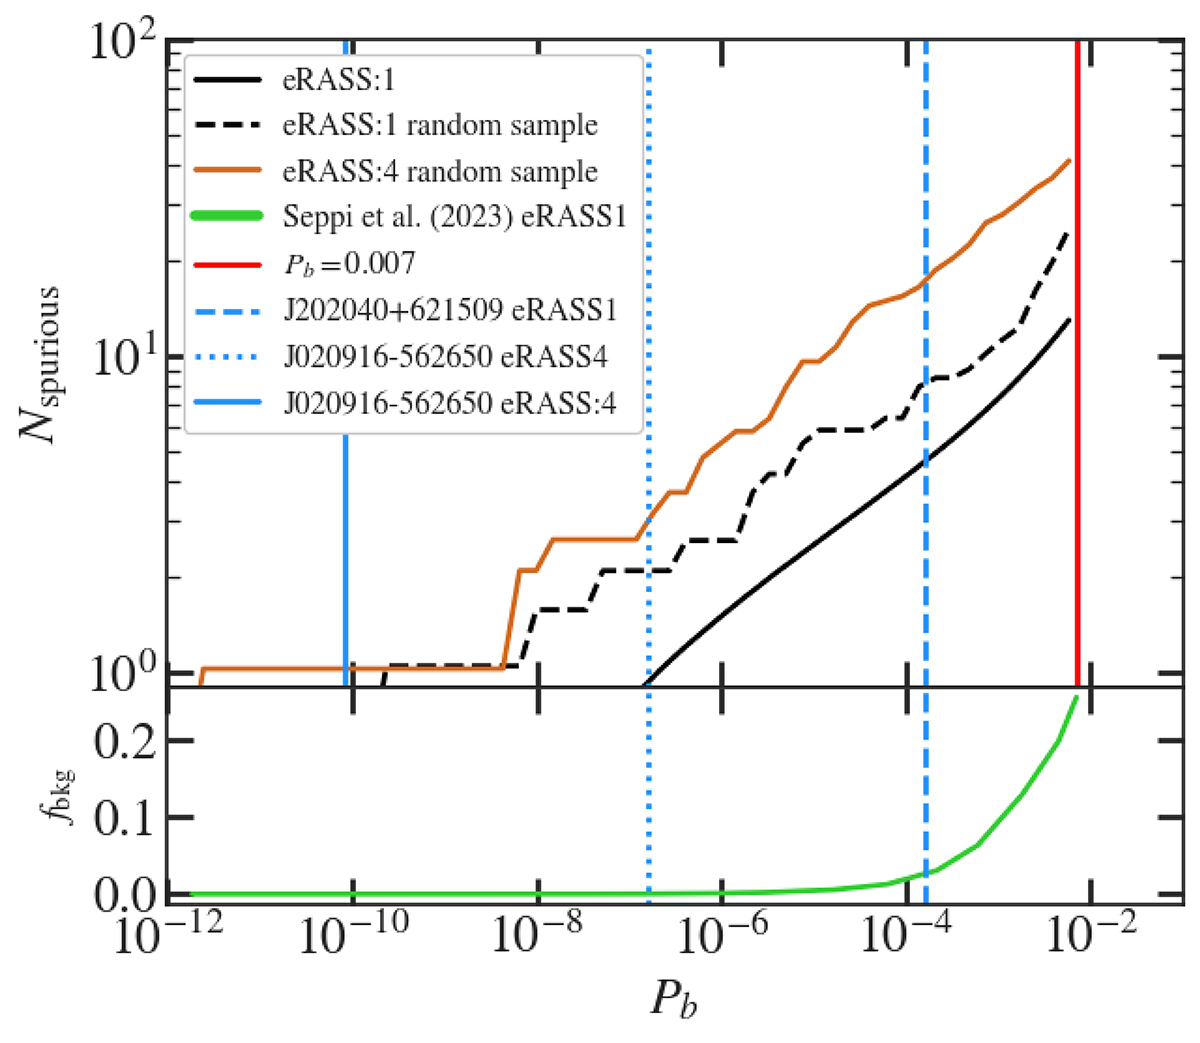
Fig. 5.
Download original image
Chance alignment. Upper panel: The cumulative distribution of expected random (unrelated) X-ray detections from forced photometry using a circular aperture of radius 30″ around 1604 optical quasar candidate positions. The black curve is the estimate obtained from Eq. (2). for a single eRASS survey. The black dashed curve shows an empirical estimate of the same number based on a random sample of positions in the surveyed field. The brown curve shows the number of expected contaminants obtained from a random sample in eRASS:4. Blue vertical lines indicate the Pb values of the best detection of quasars discovered in this work in any eRASS and in eRASS:4 (if available). Lower panel: Fraction of background sources fbkg expected to be detected in eRASS1 from a simulation by Seppi et al. (2022).
Current usage metrics show cumulative count of Article Views (full-text article views including HTML views, PDF and ePub downloads, according to the available data) and Abstracts Views on Vision4Press platform.
Data correspond to usage on the plateform after 2015. The current usage metrics is available 48-96 hours after online publication and is updated daily on week days.
Initial download of the metrics may take a while.