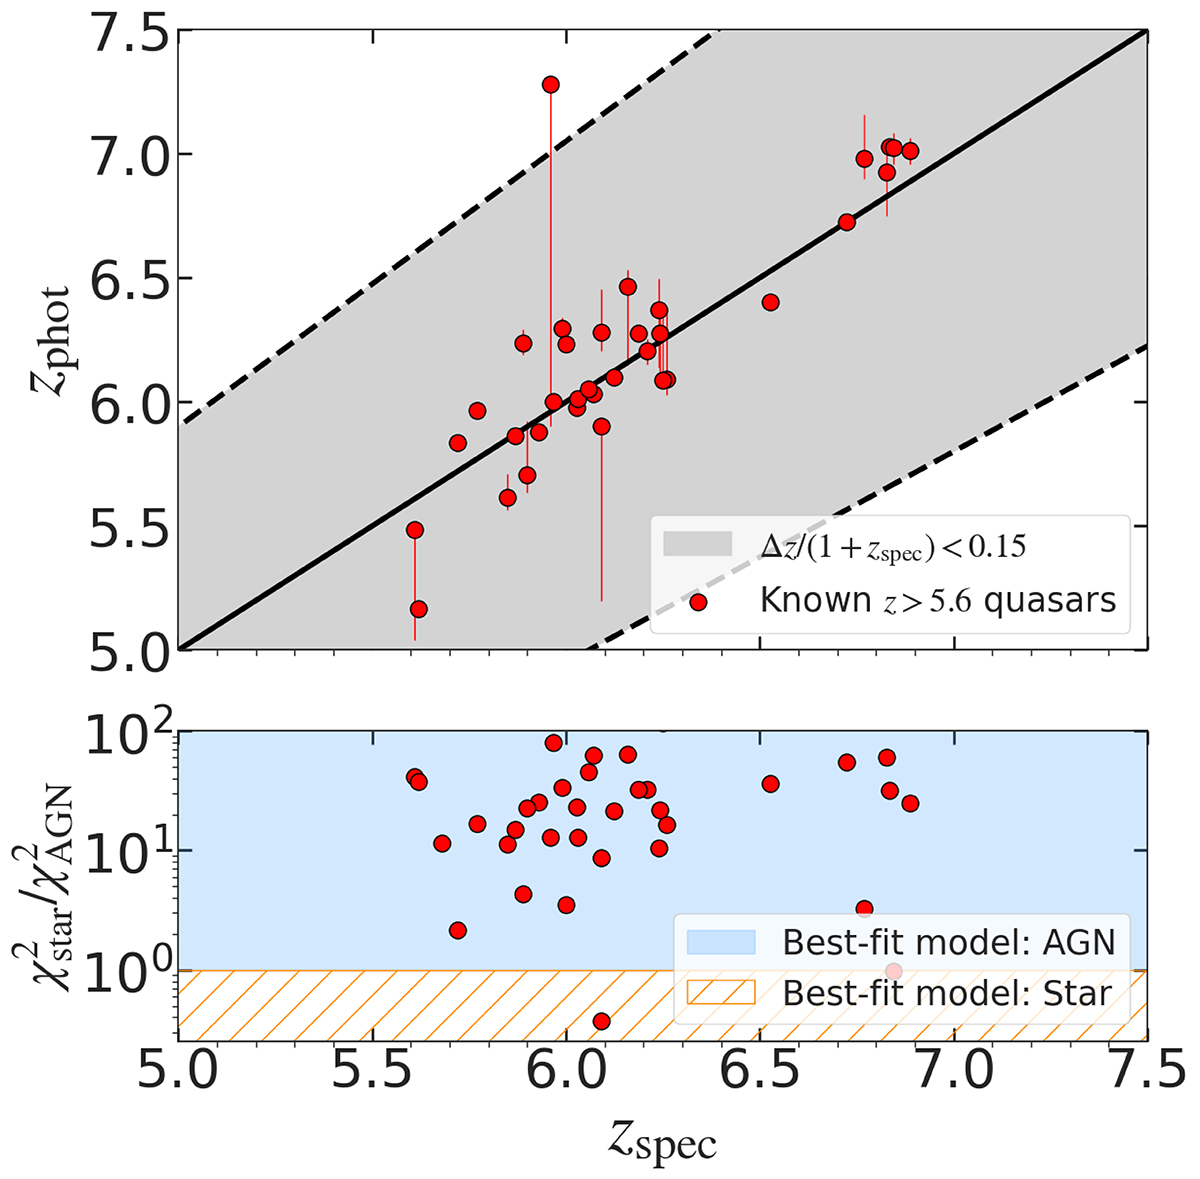
Fig. 2.
Download original image
Le PHARE test run on previously spectroscopically confirmed z > 5.6 quasars. Upper panel: The estimated photometric redshift zphot is compared to the true spectroscopic value zspec. The grey shaded area indicates the region within which Δz < 0.15 × (1 + zspec) where Δz = ∣zspec − zphot∣. Lower panel: The ratio of χ2 of the stellar and the AGN or galaxy template are shown in the lower panel. In only two cases, the stellar solution is preferred.
Current usage metrics show cumulative count of Article Views (full-text article views including HTML views, PDF and ePub downloads, according to the available data) and Abstracts Views on Vision4Press platform.
Data correspond to usage on the plateform after 2015. The current usage metrics is available 48-96 hours after online publication and is updated daily on week days.
Initial download of the metrics may take a while.