Fig. C.2.
Download original image
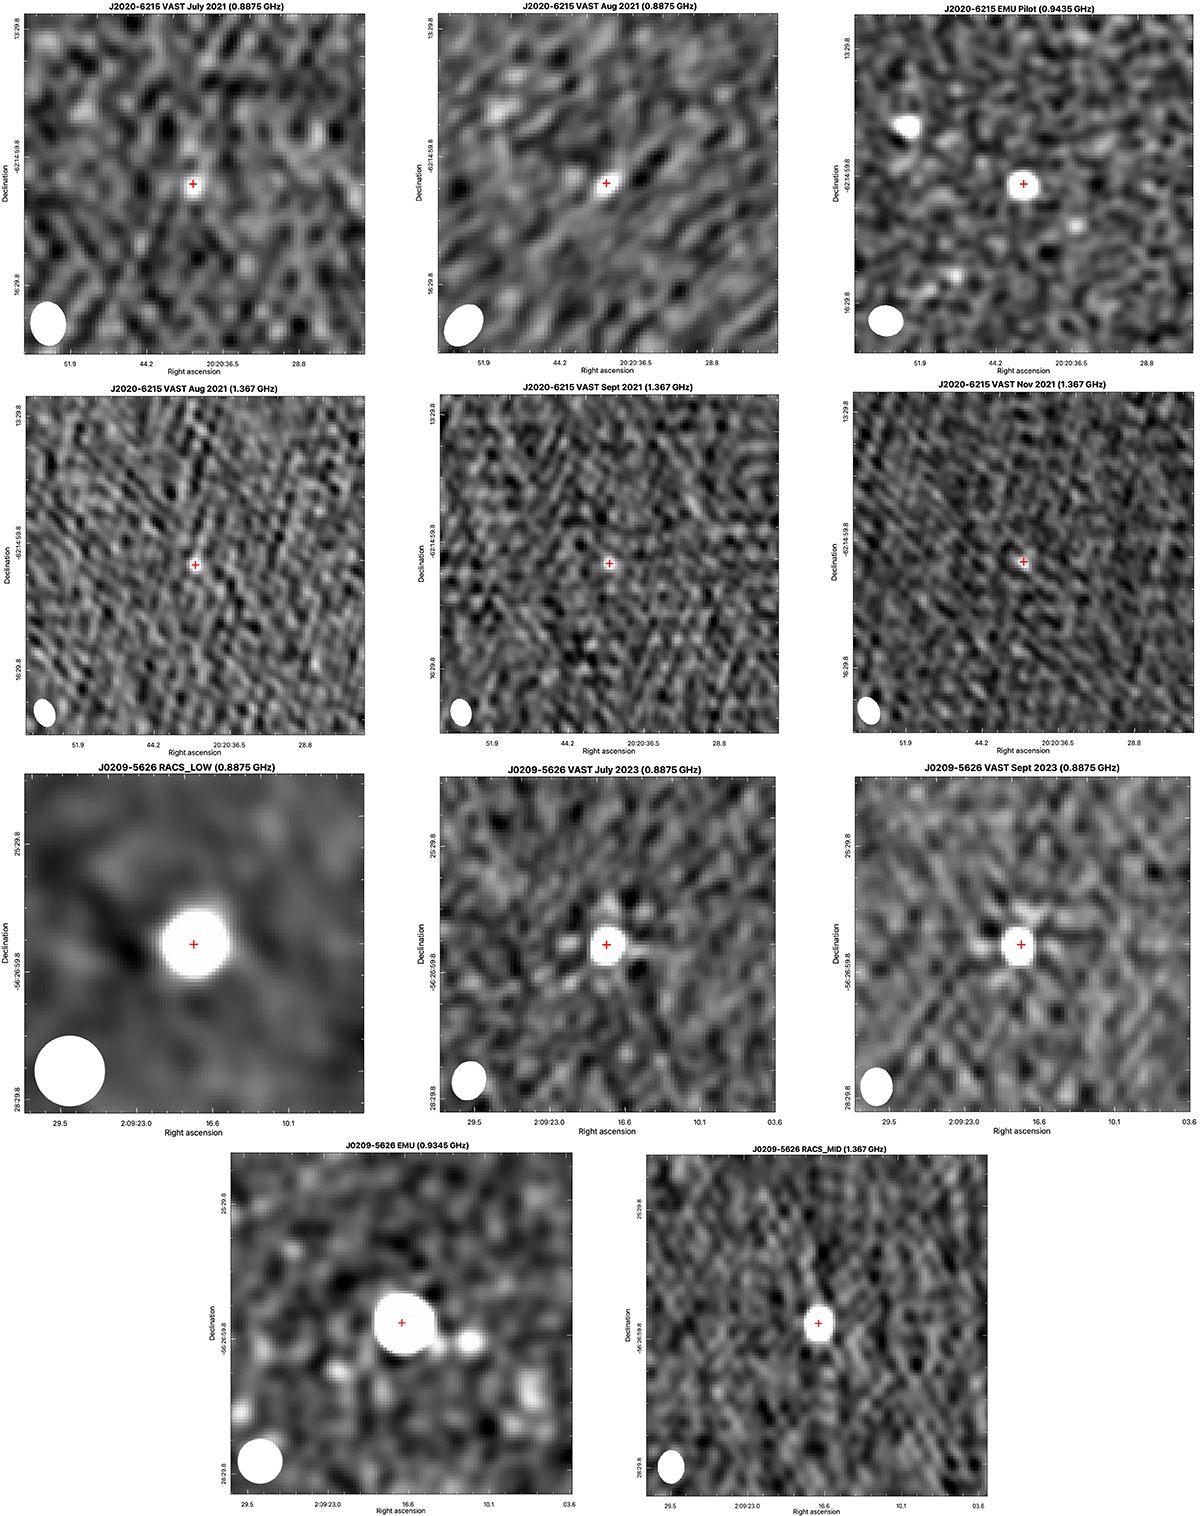
4′ × 4′ cutouts radio images of J2020−6215 (first and second row) and J0209−5626 (third and fourth row), ordered in increasing frequency. Both sources are clearly detected in all the images. The red cross represents the position of the optical source, and the synthesised beam of each observation is shown in the bottom left-hand corner.
Current usage metrics show cumulative count of Article Views (full-text article views including HTML views, PDF and ePub downloads, according to the available data) and Abstracts Views on Vision4Press platform.
Data correspond to usage on the plateform after 2015. The current usage metrics is available 48-96 hours after online publication and is updated daily on week days.
Initial download of the metrics may take a while.