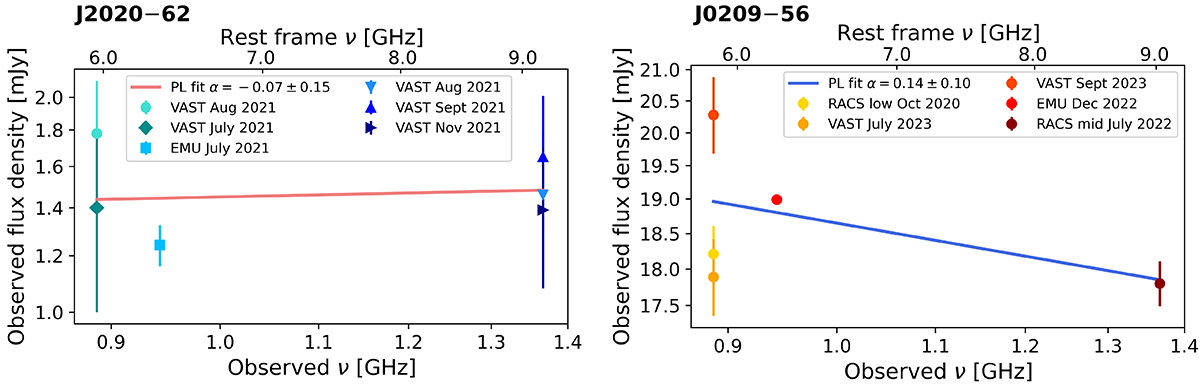
Fig. C.1.
Download original image
Observed radio spectral energy distribution of J202040−621509 (left and J020916−562650 (right from 0.887 to 1.37 GHz. The estimated flux densities are reported in the legend, together with the date of observation and the value of the best fit spectral index. The radio data of J020916−562650 at 0.887 GHz suggest a hint of variability. Simultaneous radio observations are crucial to reveal the true radio spectral energy distribution.
Current usage metrics show cumulative count of Article Views (full-text article views including HTML views, PDF and ePub downloads, according to the available data) and Abstracts Views on Vision4Press platform.
Data correspond to usage on the plateform after 2015. The current usage metrics is available 48-96 hours after online publication and is updated daily on week days.
Initial download of the metrics may take a while.