Fig. 12.
Download original image
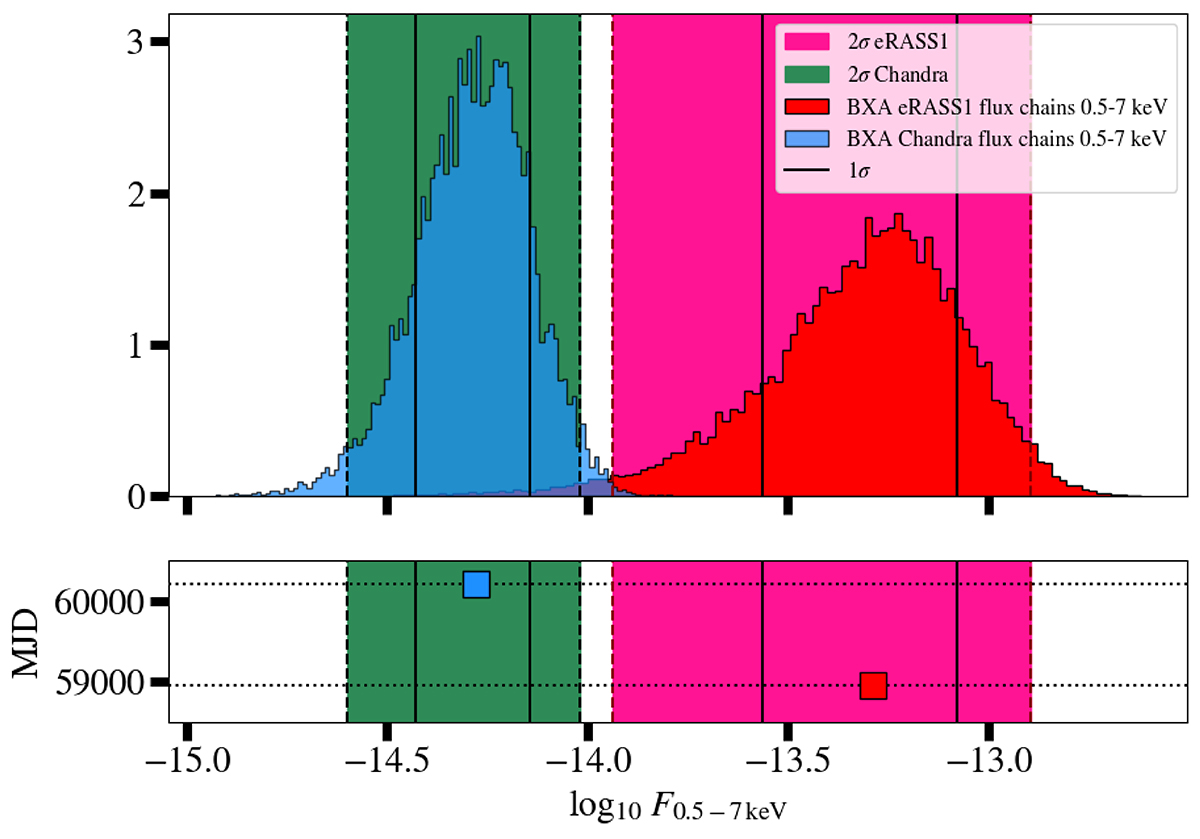
Distribution of BXAF0.5 − 7 keV fluxes for the eRASS 1 (in blue) and Chandra observations (red) of J202040−621509. The vertical black lines show the locations of the 15.9-th and 84.1-th percentiles of the distributions. The green and pink regions span the 2.3-th and 97.7-th percentiles of the distributions. The lower panel shows the time separation in days between the two observations. We measured a decrease in the source flux between the two epochs significant at the ∼2σ level.
Current usage metrics show cumulative count of Article Views (full-text article views including HTML views, PDF and ePub downloads, according to the available data) and Abstracts Views on Vision4Press platform.
Data correspond to usage on the plateform after 2015. The current usage metrics is available 48-96 hours after online publication and is updated daily on week days.
Initial download of the metrics may take a while.