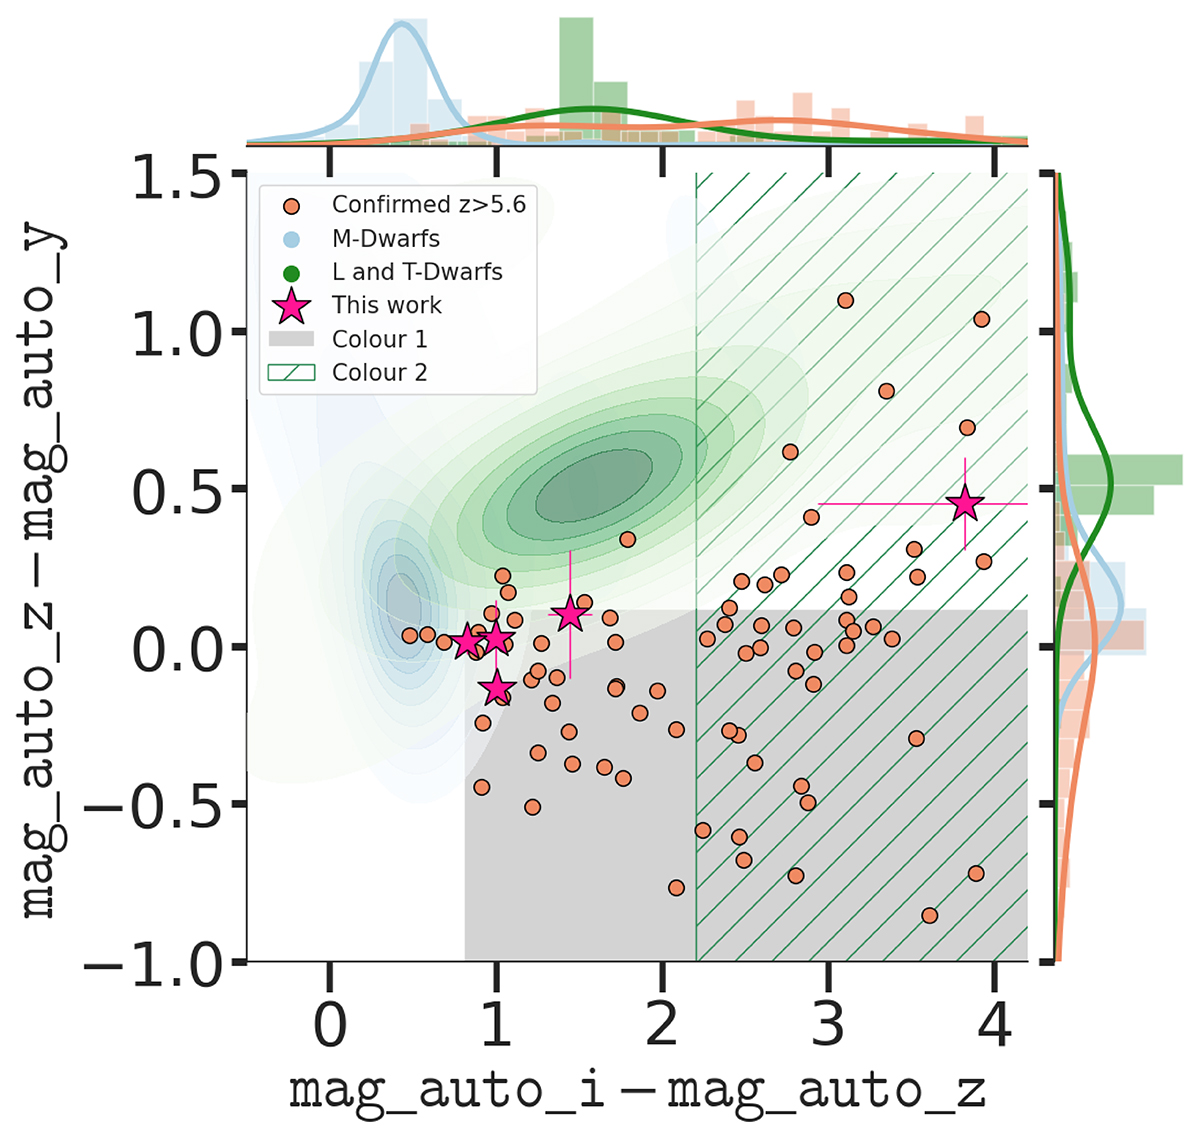
Fig. 1.
Download original image
Colour-selection diagram. The hashed and grey regions correspond to the colour space from which we pre-selected high-redshift quasar candidates for the present pilot survey. Gaussian Kernel density estimates of DES detected M-dwarfs (Best et al. 2018) and L/T-dwarfs (Liu et al. 2002; Hawley et al. 2002; Cruz et al. 2003, 2007; Chiu et al. 2008; Reid et al. 2008; Schmidt et al. 2010; Burningham et al. 2010, 2013; Kirkpatrick et al. 2010, 2011; Wahhaj et al. 2011; Day-Jones et al. 2013; Marocco et al. 2013, 2014, 2015; Best et al. 2015; Cardoso et al. 2015; Tinney et al. 2018) are displayed as shaded green and shaded blue areas, respectively. DES detected, spectroscopically confirmed z > 5.6 quasars compiled in Fan et al. (2023) and additional sources from Yang et al. (2024) are shown as salmon red circles. 1D colour distributions of the samples from the literature are shown in the marginal histograms. Magenta stars indicate new quasars discovered in this work. Four of these discoveries are located at the edge of the grey selection box, close to the contamination region of brown dwarfs.
Current usage metrics show cumulative count of Article Views (full-text article views including HTML views, PDF and ePub downloads, according to the available data) and Abstracts Views on Vision4Press platform.
Data correspond to usage on the plateform after 2015. The current usage metrics is available 48-96 hours after online publication and is updated daily on week days.
Initial download of the metrics may take a while.