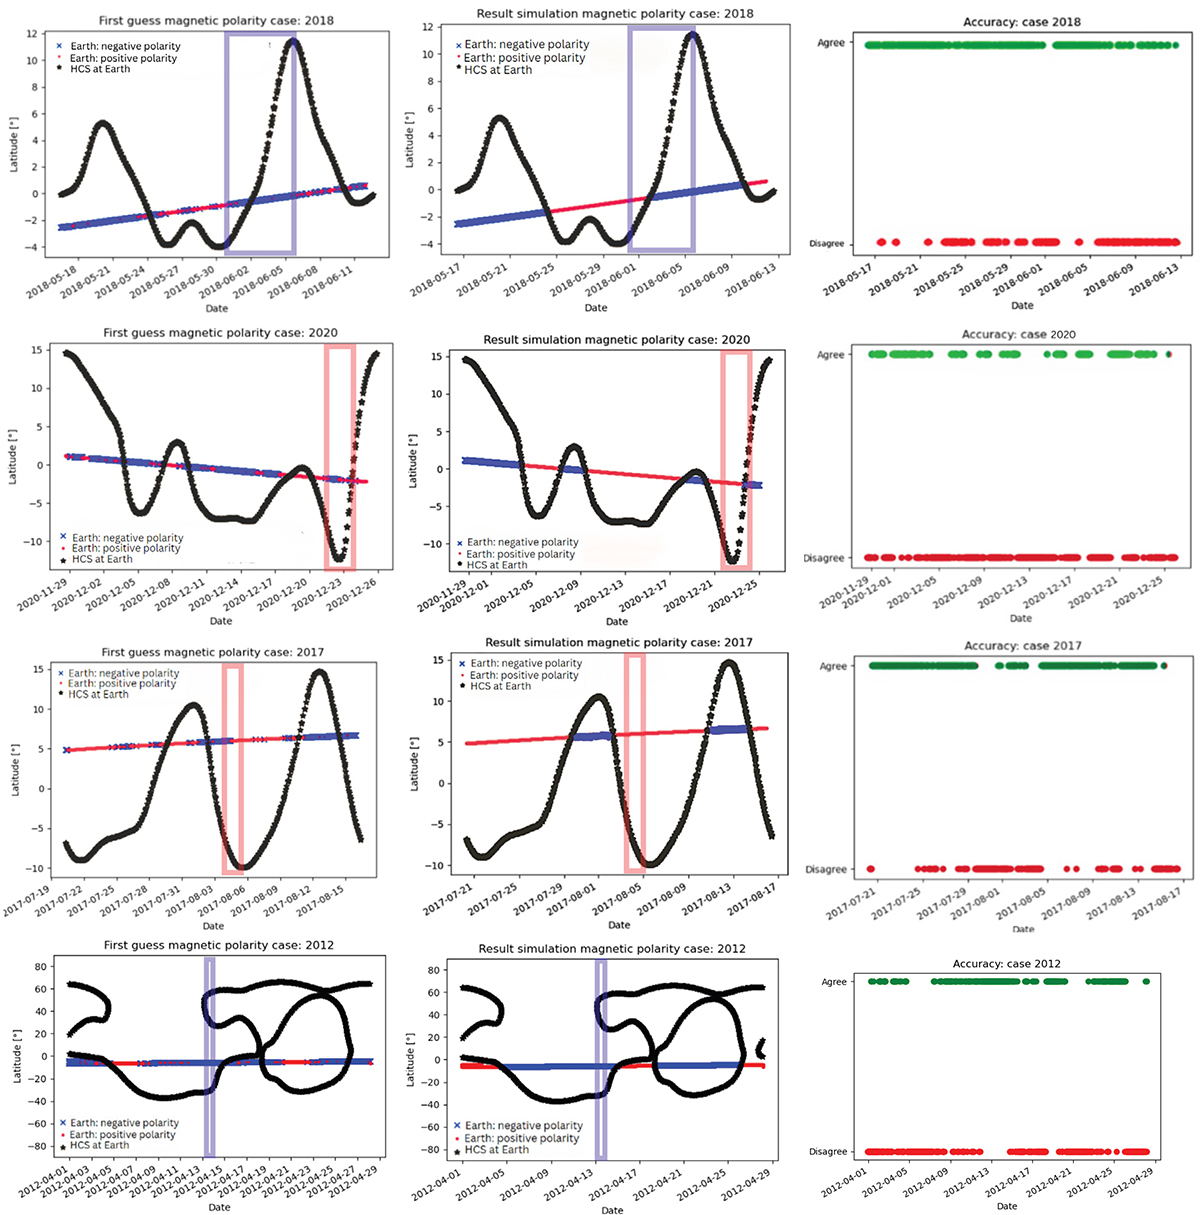
Fig. 6.
Download original image
Validation of the global Earth magnetic connectivity using in situ polarity. Each line corresponds to one of the studied events (event 1 for line 1, and so forth). For the left column, we plot the Earth’s latitude for each date over the simulated period and indicate the corresponding in situ polarity measured by ACE with a colored box (blue for negative, and red for positive). We put this in perspective with the simulated HCS at Earth’s orbit (black line). The middle column is essentially the same plot, except that this time, the polarity at Earth positions comes from the MHD simulations. Finally, the right column quantifies the agreement between in situ and simulated polarity for each date (in green when there is agreement, and in red otherwise). These plots were inspired by the work of Badman et al. (2022).
Current usage metrics show cumulative count of Article Views (full-text article views including HTML views, PDF and ePub downloads, according to the available data) and Abstracts Views on Vision4Press platform.
Data correspond to usage on the plateform after 2015. The current usage metrics is available 48-96 hours after online publication and is updated daily on week days.
Initial download of the metrics may take a while.